
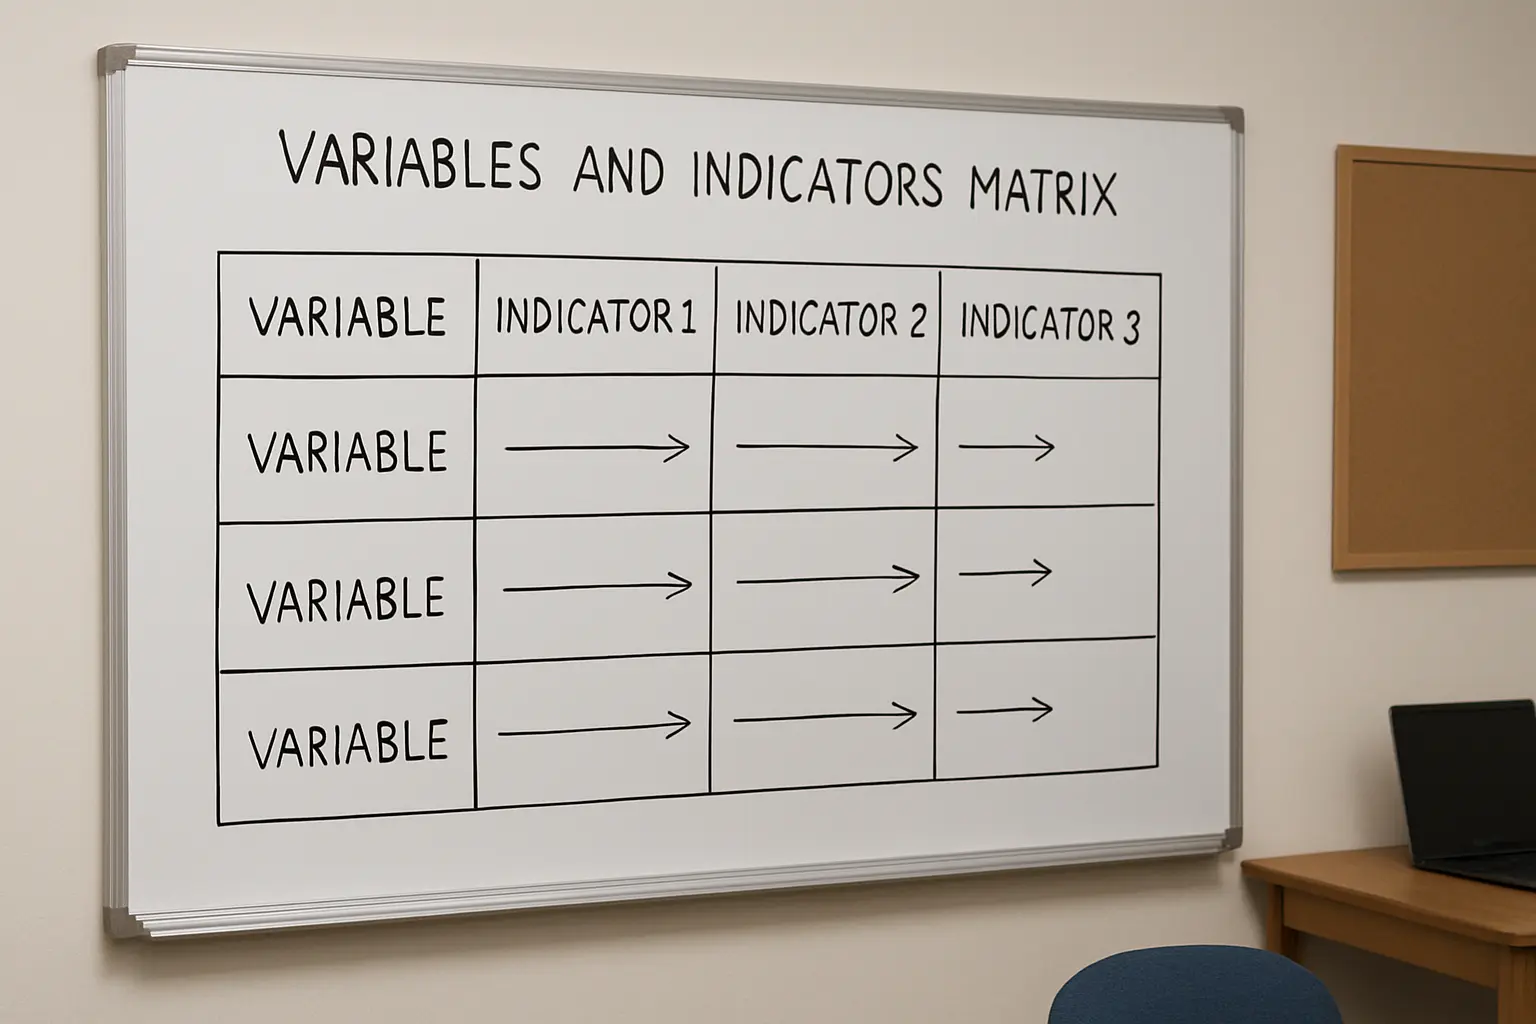
A BSA accountancy thesis consistency matrix is the Chapter 3 table that proves every variable in your statement of the problem is actually measurable: variable, conceptual definition, operational definition, indicators, instrument, and the statistical tool that analyzes it, laid out row by row. Below is that matrix filled in with one worked example — internal control practices and fraud prevention among small and medium enterprises (SMEs) — built on the COSO Internal Control-Integrated Framework, so you can see how each column has to trace into the next, then build your own matrix from your own variables.
This is a labelled model, not a real dataset: every scale range and statistical output is illustrative. For the general seven-step procedure behind building this kind of table across other disciplines, the site’s own operationalization of variables guide covers six worked studies at a survey level; this piece goes one accountancy example deep instead.
Why accountancy needs its own version of this matrix
A BSA thesis panel checks the consistency matrix against two things a general guide cannot anticipate: whether the internal-control or financial framework named is the one the profession actually recognizes, and whether the statistical tool matches the data type accounting variables usually produce — Likert-scale perception data from an internal-control questionnaire on one side, ratio-scale figures pulled from financial statements or audit findings on the other. A matrix that treats both sides the same way, defaulting to a weighted mean for everything, is the single most common accountancy Chapter 3 fault a statistics adviser flags. A second, quieter fault is naming a framework in Chapter 1 — COSO, or Cressey’s fraud triangle, or PFRS for SMEs — and then never actually operationalizing its components in Chapter 3, so the matrix and the theoretical framework read as two unrelated documents stitched together.
Building the matrix in your own Chapter 3, in order
Work left to right, one variable at a time, rather than filling one column across every variable first — a matrix built column by column tends to produce indicators that do not actually match their own operational definition. First, copy the exact variable name from your statement of the problem, not a paraphrase of it. Second, write the conceptual definition from a cited source or a recognized framework, in one sentence. Third, write the operational definition as what you will actually observe or ask about — this sentence has to be genuinely different from the conceptual one, describing an observable action or a rated statement rather than restating the abstract concept. Fourth, list the indicators the operational definition implies, each specific enough that a reader could write a questionnaire item from it directly. Fifth, name the instrument section and item type, and the exact statistical tool that will analyze that row — not a general “descriptive statistics” placeholder, but the named test.
The matrix, filled in: internal control practices and fraud prevention among SMEs
The general statement behind this example: “This study determined the relationship between internal control practices and fraud prevention among small and medium enterprises in [City/Province].” The independent variable is internal control practices, operationalized through the five COSO components; the dependent variable is fraud prevention, operationalized through the frequency and value of detected irregularities and the staff’s own confidence in the control environment.
| Variable | Conceptual Definition | Operational Definition | Indicators | Instrument / Statistical Tool |
|---|---|---|---|---|
| Control environment (IV, COSO component 1) | The set of standards, processes and structures that provide the discipline supporting internal control across the organization. | Employees’ rated agreement on the presence of a code of conduct, management’s demonstrated commitment to integrity, and clearly assigned authority and responsibility. | Written code of conduct exists; management models ethical behavior; job descriptions define authority limits. | Questionnaire Part II, 4-point Likert scale; weighted mean and standard deviation. |
| Risk assessment (IV, COSO component 2) | The process of identifying and analyzing risks to the achievement of the entity’s objectives. | Employees’ rated agreement on whether the SME conducts a regular risk review and identifies fraud risk specifically. | Periodic risk review conducted; fraud risk assessed separately from operational risk. | Questionnaire Part II, 4-point Likert scale; weighted mean. |
| Control activities (IV, COSO component 3) | The actions established through policies and procedures that help ensure management directives are carried out. | Employees’ rated agreement on the presence of segregation of duties, transaction approval limits and physical safeguards over assets. | Segregation of duties observed; approval hierarchy for disbursements; restricted access to cash and inventory. | Questionnaire Part II, 4-point Likert scale; weighted mean. |
| Information and communication (IV, COSO component 4) | The quality of information generated and shared to support the functioning of internal control. | Employees’ rated agreement on whether financial reports are timely, accurate and communicated to the relevant decision-makers. | Timely financial reporting; clear reporting lines; whistleblowing channel exists. | Questionnaire Part II, 4-point Likert scale; weighted mean. |
| Monitoring activities (IV, COSO component 5) | Ongoing and separate evaluations used to ascertain whether internal control components are present and functioning. | Employees’ rated agreement on whether internal or external audits, spot checks or reconciliations occur regularly. | Regular internal audit or spot check; bank reconciliation performed monthly; corrective action tracked. | Questionnaire Part II, 4-point Likert scale; weighted mean. |
| Fraud prevention (DV) | The extent to which an organization’s controls reduce the occurrence and financial impact of fraudulent acts. | The number and peso value of detected irregularities over a stated period, and staff confidence that fraud would be detected promptly. | Count of flagged transactions; value of confirmed irregularities; staff confidence rating. | Questionnaire Part III (confidence rating) + secondary data extraction (incident log); Pearson’s r or Spearman’s rho against each IV component. |
Read across any single row and it should answer one question on its own: what exactly is being measured, and with what. Read down the Indicators column and every entry should be something a respondent could genuinely confirm or deny about their own workplace, not an abstract judgment only an outside auditor could make — that distinction is what keeps the instrument answerable by ordinary SME staff rather than requiring an accountant’s own technical judgment to complete.

How the verbal interpretation range is computed, not copied
For the five Likert-scored control components, the range comes from the scale’s own division, the same computed-not-copied method the site’s general operationalization guide insists on: a 4-point scale has a range of 3, divided by 4 points gives a class width of 0.75, producing 1.00–1.75 “Not Practiced,” 1.76–2.50 “Rarely Practiced,” 2.51–3.25 “Often Practiced” and 3.26–4.00 “Always Practiced.” A matrix that copies a 1.00–1.80/1.81–2.60 range built for a 5-point scale onto a 4-point instrument is a fault a statistics adviser catches on sight, because the arithmetic simply does not fit.
Choosing the statistical tool: perception data versus financial data
The comparison a BSA panel actually wants to see stated plainly: weighted mean and standard deviation describe each control component’s perceived strength on its own; Pearson’s r (for normally distributed data, confirmed with a Shapiro-Wilk or Kolmogorov-Smirnov test first) or Spearman’s rho (once that test flags non-normal data) tests whether a stronger-rated control component associates with fewer or lower-value detected irregularities; and where the dependent variable is drawn from actual financial or audit records rather than perception, a simple linear regression can model the predictive relationship instead of a correlation alone, provided the sample of SMEs is large enough to support it — a regression with more predictors than the sample can support is a fault examiners catch immediately, so the number of IV components entered should be justified against the sample size, not assumed. The full field-by-field logic behind which test fits which BSA accountancy design — financial literacy, MSME internal control, cloud accounting adoption, CPALE readiness — is worked through in the site’s own accountancy statistical-treatment guide.
Validity, reliability and the instrument itself
Each Likert-scored indicator column needs to map to an actual questionnaire item, content-validated by at least three expert validators — an audit practitioner, an accountancy faculty member and, where feasible, a Certified Internal Auditor or CPA in practice — with a pilot test and a Cronbach’s alpha reported per COSO component rather than one pooled figure across all five, since they are conceptually distinct constructs. The general validation procedure, pilot-test sizing and reliability-coefficient reporting follow the same standard covered in the site’s instrument validation guide and the Chapter 3 methodology guide.
What makes a consistency matrix pass an accountancy panel
Every indicator traces to a real, nameable instrument item or data field — no indicator that sounds right but has nothing measuring it; the framework named (COSO or another) is cited correctly and applied consistently across all five components rather than mixed with an unrelated model; the statistical tool matches the data type of each variable rather than defaulting to one test for everything; and the conceptual and operational definitions are genuinely different sentences, not the same sentence phrased twice — a fault the site’s own conceptual framework guide also flags on the framework side of Chapter 1. A matrix that clears all four checks is usually the fastest Chapter 3 section to defend, because every question a panel can ask about it already has a row-level answer.
Build your own consistency matrix from your own variables
Tesify drafts the Chapter 3 matrix from your own independent and dependent variables — the conceptual and operational definitions, the indicators that trace to a real instrument item, and the statistical tool that fits your data type. Over 9,000 students have used it to write more than 15,000 chapters, and every word is still written by you.
Frequently asked questions
How is this different from the site’s general operationalization guide?
The general guide walks through the matrix-building procedure once across six different disciplines at a survey level. This piece goes deep on one BSA accountancy example only, naming the accounting-specific frameworks, indicators and statistical tools an accountancy panel actually expects, which the general guide does not cover.
Do I need to use COSO specifically, or can I use a different internal control framework?
COSO’s Internal Control-Integrated Framework is a widely taught and cited internal control framework, but if your adviser or your chosen standard uses a different framework, adapt the same five-column matrix structure to that framework’s own components instead.
Can my consistency matrix use secondary financial data instead of a survey?
Yes, if your variables are drawn from published financial statements or audit reports rather than perception data; the matrix still needs an operational definition and a named statistical tool for each variable, but the instrument column becomes the data source and extraction method instead of a questionnaire part.
What is the most common mistake in a BSA consistency matrix?
Listing an indicator that no questionnaire item or data source actually measures — every row must trace forward to a real instrument item or data field, not just a plausible-sounding construct.
How many indicators should each variable have?
Enough to cover the construct without padding — most Philippine accountancy matrices use three to five indicators per variable; fewer than three usually under-represents the construct, and more than five is rarely justifiable within a single Chapter 3 table without splitting the variable into sub-components.