| Format | What it shows best | Best for | Where it falls short |
|---|---|---|---|
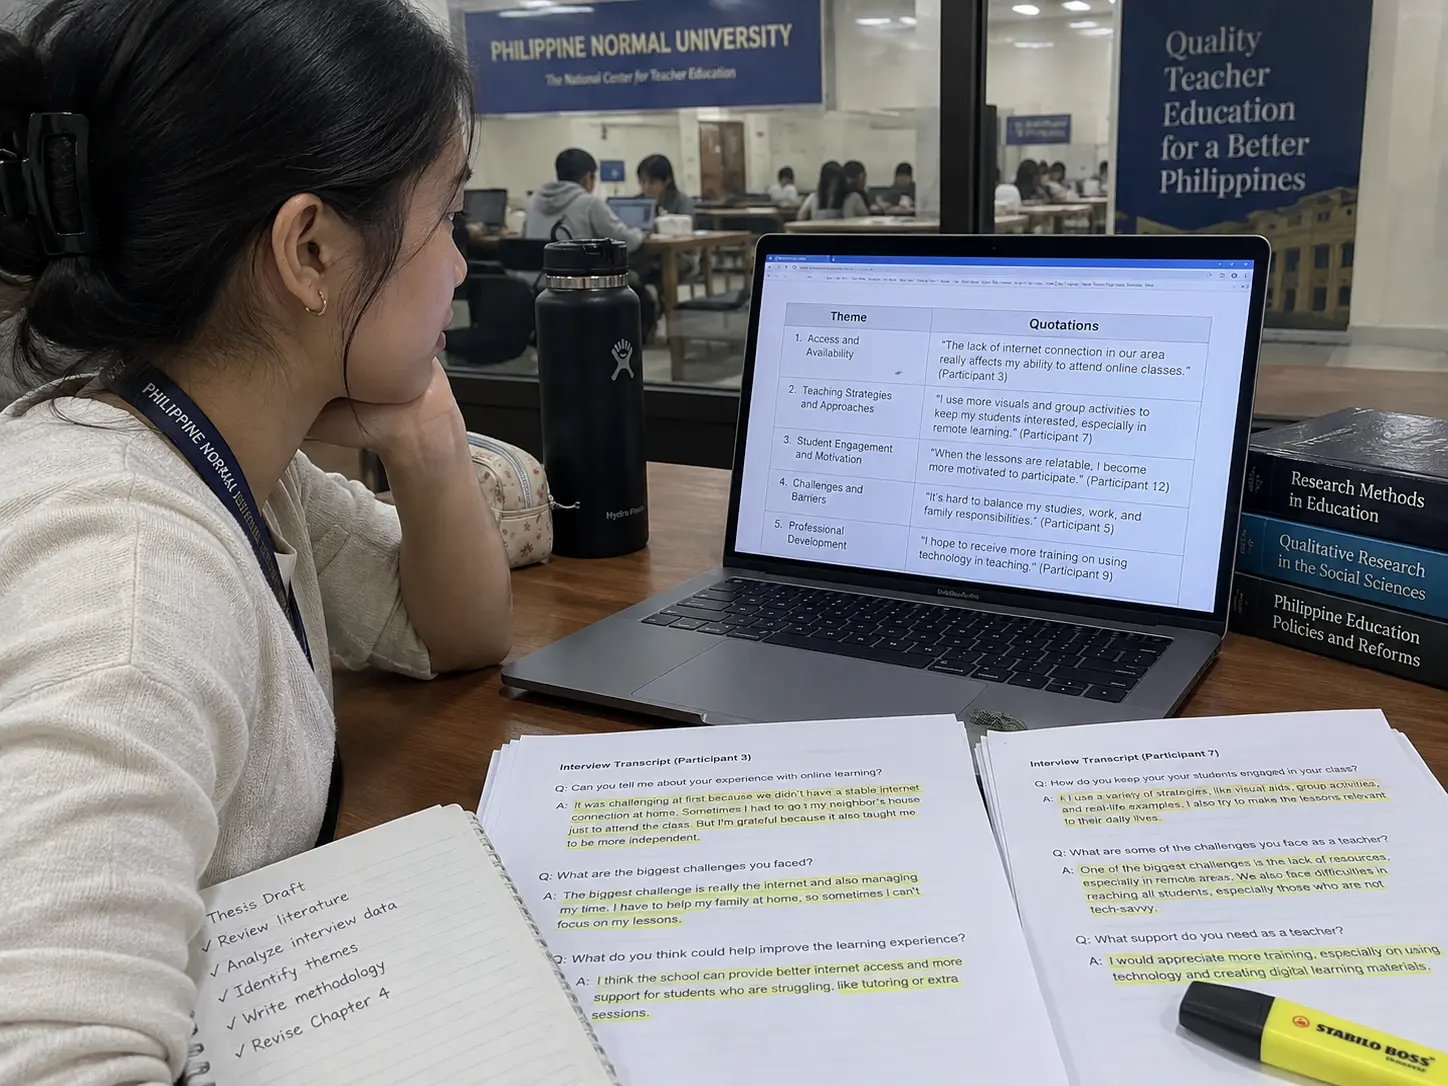
| Theme-and-verbatim table | Each theme paired with a direct participant quotation that illustrates it | Thematic analysis, phenomenological studies — any design built around Braun and Clarke-style coding | Can read as a list of quotes without synthesis if the surrounding prose does not explain why the quote fits the theme |
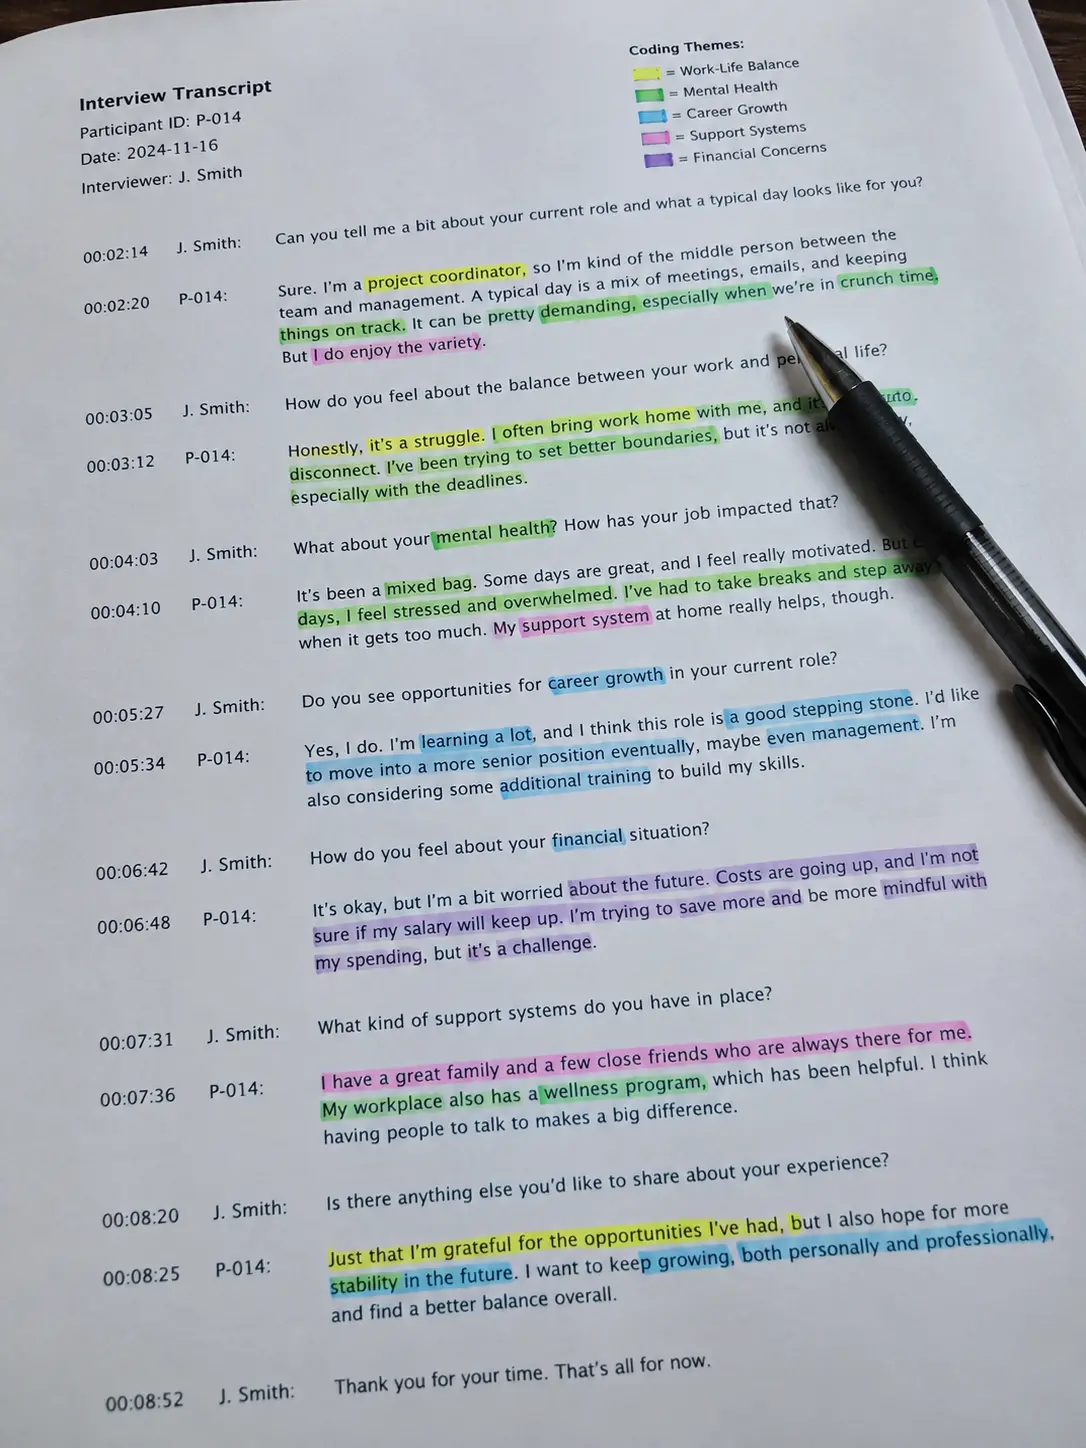
| Thematic map / concept diagram | How themes and sub-themes relate to each other visually — hierarchy, overlap, sequence | Studies with several interconnected themes, or a process the participants described in stages | Needs real analytical relationships behind the arrows; a diagram used only for visual variety, with no relationship it actually demonstrates, invites the question of what it adds |
| Frequency-of-mention table | How many participants or data sources raised a given theme or sub-theme | Studies wanting to show relative salience across a modest number of respondents without claiming statistical significance | Risks reading as pseudo-quantification if not clearly framed as a qualitative count, not a statistical result |
| Narrative prose only, no table or figure | The texture and flow of a single case or a small number of in-depth accounts | Case studies and narrative inquiry with very few participants, where a table would fragment a story better told continuously | Longer sections can feel unstructured to a reader looking for a quick overview; needs strong signposting (clear sub-headings per theme) to stay navigable |
| Participant profile table | Who the participants are, presented once before the findings so the reader has context | Every qualitative design, regardless of how the findings themselves are presented | Not a substitute for presenting the findings themselves — a profile table alone answers “who,” not “what was found” |
How to present results for a qualitative education thesis
Use a theme-and-verbatim table as your primary presentation format for a thematic or phenomenological study, add a thematic map only where the themes genuinely relate to each other in a way prose alone would obscure, and reserve narrative-only presentation for case studies and narrative inquiry with very few participants. A participant profile table belongs in every qualitative Chapter 4, presented once before the findings themselves. The formats are not interchangeable: a table organizes and compares, a figure shows relationships, and prose carries nuance and voice — most qualitative education theses need at least two of the three working together, not one format alone.
1. The theme-and-verbatim table: the workhorse of thematic and phenomenological studies
Many BEEd and BSEd qualitative theses use thematic analysis or a phenomenological approach, and both produce findings that a table organizes naturally: one row per theme or sub-theme, one column for a representative verbatim quotation, and space for the researcher’s brief interpretive comment. A workable structure (illustrative rows, not real participants):
| Theme | Sub-theme | Illustrative quotation | Participant |
|---|---|---|---|
| Classroom management challenges | Large class size | “With forty-five learners in one room, I cannot give feedback to everyone before the period ends.” | P3, Grade 4 teacher |
| Classroom management challenges | Mixed-ability grouping | “The pace that works for my advanced readers loses the learners who are still decoding.” | P7, Grade 3 teacher |
Two rules make this table defensible rather than decorative. First, the quotation has to illustrate the theme, not merely mention a related word — a quote about class size belongs under a class-size sub-theme, not wherever it happens to fit the page layout. Second, every quotation needs the paragraph around the table to explain, in the researcher’s own analytical voice, why it was selected and what it demonstrates; a table of quotes with no interpretive prose around it reads as evidence without argument, which is one of the most common qualitative Chapter 4 objections. If you are still deciding whether your study should be qualitative at all, the trade-offs against a quantitative design are set out in quantitative versus qualitative research for your thesis, and once qualitative is settled, the theory framing your themes should already trace to a named source, the way the education-specific options are laid out in choosing a theoretical framework for an education thesis.
2. Thematic maps: only when themes actually relate to each other
A thematic map or concept diagram earns its place when the findings describe a genuine structure — a hierarchy of main themes and sub-themes, a sequence participants described (before, during, after an intervention), or an overlap between two themes that a table’s flat rows cannot show. A diagram with boxes and arrows added purely because “qualitative theses usually have a figure” is the opposite of what a figure is for: every arrow should represent a relationship you can point to in the data, and every box should be a theme the reader has already met in the table above it.
For a diagram showing a process participants described, label the stages in the participants’ own conceptual order, not the order the researcher finds tidiest — a process diagram that reorganizes participants’ lived sequence into a “logical” one the researcher prefers is quietly distorting the data it claims to represent.
3. Frequency-of-mention tables: use cautiously and label honestly
Counting how many participants raised a given theme (from a sample of, say, twelve interviews) can help a reader see relative salience, but the number needs to be framed as a qualitative pattern, not treated as if it were a statistical finding. “Eight of twelve participants described time pressure as their primary challenge” is a defensible descriptive statement; presenting the same figure in a bar chart with a percentage and no caveat borrows quantitative visual language for a qualitative claim, and a panel with a quantitative background will ask whether that framing is intentional.
4. Narrative-only presentation: for case studies and narrative inquiry
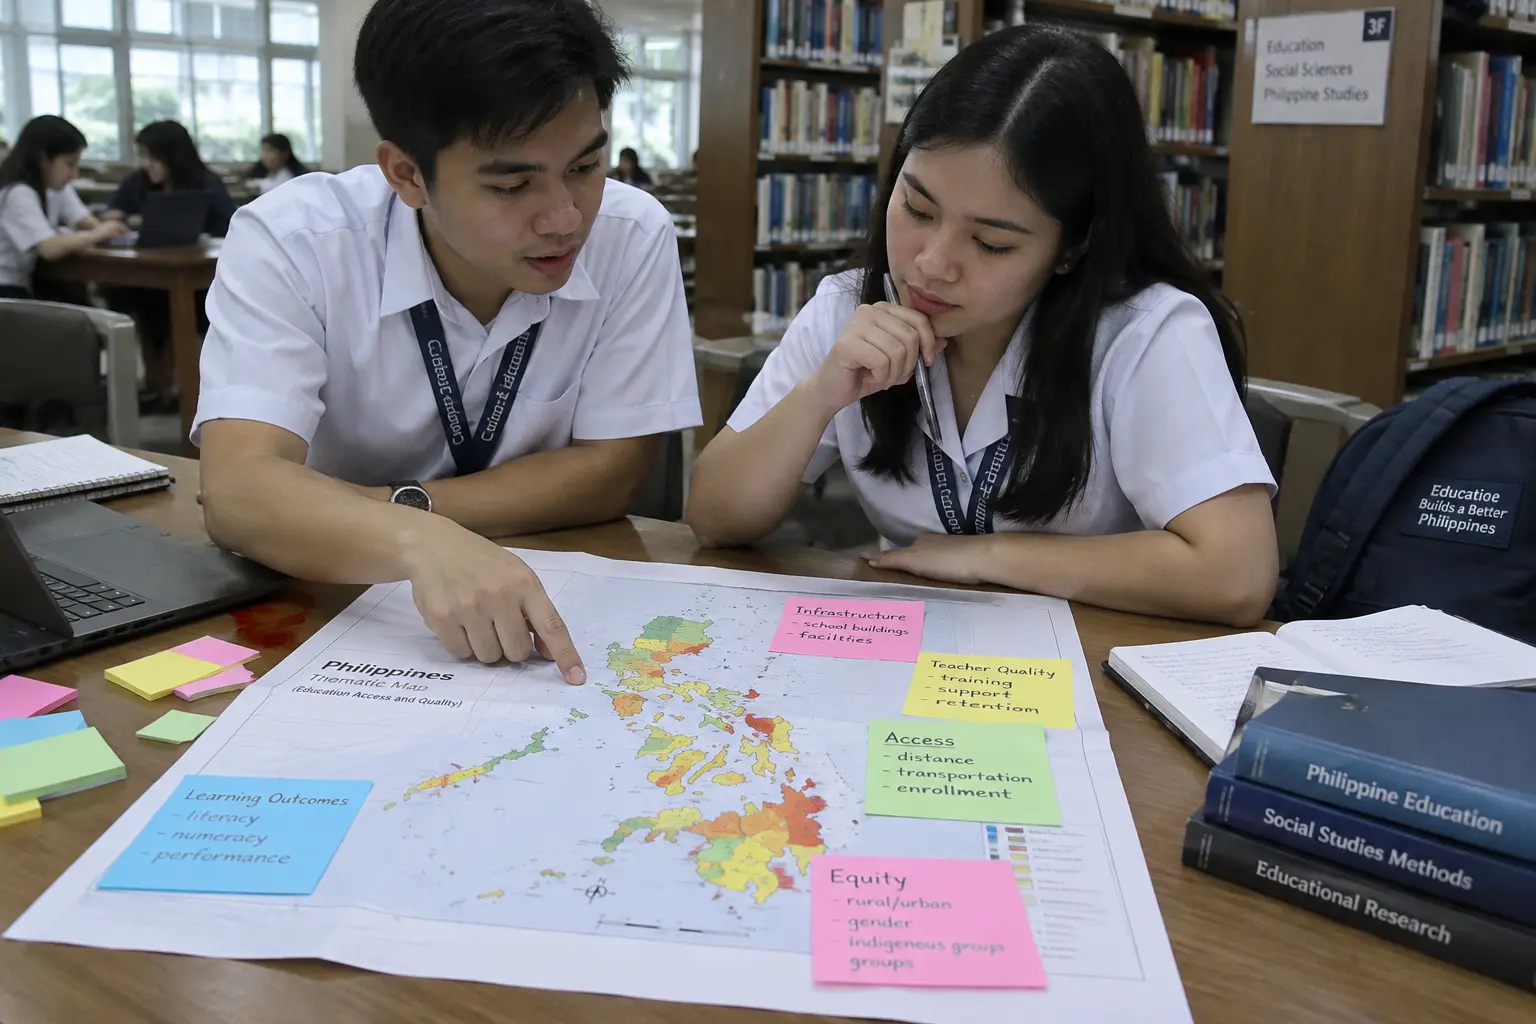
A case study of one school, one classroom or one teacher’s practice, or a narrative inquiry following two or three participants’ stories in depth, often reads better as continuous prose organized by clear sub-headings than as a series of tables that fragment a single coherent account. Where you choose this format, discipline the prose the way a table would: one sub-heading per theme or narrative arc, a clear topic sentence per section stating the finding before the illustrative detail, and consistent depth across sections so one theme is not three paragraphs while another is three sentences.
5. The participant profile table: present it once, before the findings
Whichever format carries your main findings, open Chapter 4 with a simple participant profile table — pseudonym or code, relevant demographic or professional details, years of experience or grade level taught, anything the reader needs to interpret a quotation later without you re-explaining who P3 is every time the name appears. This table does not carry findings; it carries context, and it belongs before, not mixed into, the findings tables or narrative. Whichever instrument produced your data — an interview guide, a focus-group protocol, an observation checklist — its own validation and piloting is a separate step covered in the site’s general guide to research instrument validation for a Philippine thesis, and the specific majors and sub-fields still open for a topic if yours is not yet fixed are listed in education thesis topics for BEEd and BSEd students.
How much does each format actually cost you in Chapter 4 length and effort?
A theme-and-verbatim table is fast to build once coding is complete, since the rows come directly from the codebook, but the surrounding interpretive prose still has to be written in full — the table alone is never sufficient. A thematic map costs more design time up front (deciding the visual structure, checking it against the data) but can shorten the prose needed afterward, since a well-built diagram does some of the explaining a paragraph otherwise would. Narrative-only presentation is the most time-intensive to write well, since there is no table scaffolding to organize your material — budget more drafting time for a narrative-inquiry Chapter 4 than for a thematic-analysis one of similar findings depth.
Frequently asked questions
Can I use more than one presentation format in the same Chapter 4?
Yes, and most qualitative education theses do — a participant profile table at the opening, theme-and-verbatim tables for the main findings, and a thematic map only where a relationship genuinely needs visual representation. Combining formats is standard; using a format that adds nothing new is the actual problem.
Does a qualitative Chapter 4 need any numbers at all?
A participant count and, cautiously, a frequency-of-mention note are both defensible, provided they are framed as descriptive qualitative information rather than statistical results. Beyond that, numbers are not required, and forcing a percentage onto a twelve-participant sample to look more rigorous usually reads as the opposite.
How many quotations should each theme have in the table?
Enough to demonstrate the theme is genuinely present across participants, not just one person’s opinion — commonly two to four illustrative quotations per major theme, though your research manual or adviser may set a different convention.
Should quotations be edited for grammar before they go in the table?
Minor cleanup of filler words is common practice in Philippine qualitative theses, but any edit should preserve the participant’s actual meaning; mark substantial edits with ellipses or brackets, and never alter a quotation’s substance to fit the theme better than it actually does.
Is a thematic map required for a phenomenological study?
No — phenomenological studies traditionally emphasize the lived experience described in participants’ own words, and a theme-and-verbatim table often serves this better than a diagram; add a figure only if your specific themes have a structural relationship worth showing visually.
How do I decide between a table and a diagram for showing how themes relate?
If the relationship is a simple hierarchy or grouping, a table with a “parent theme / sub-theme” column often communicates it as clearly as a diagram, with less design risk of implying a relationship you cannot support. Reserve a diagram for relationships a table’s rows and columns genuinely cannot represent, such as a cyclical process or a two-way influence between themes.
Should each theme get exactly the same amount of space in Chapter 4?
No — space should follow how much the data actually supports, not an artificial balance. A theme raised by every participant with rich detail legitimately runs longer than one mentioned briefly by two respondents; forcing equal length across themes pads the thin ones and compresses the substantial ones, which reads as artificial to a panel comparing your findings against your actual transcripts.
Can I present results by research question instead of by theme?
Yes, and some Philippine qualitative manuals prefer this structure — organize Chapter 4 by research question, with the relevant themes nested under each one, rather than presenting all themes together and mapping them back to questions afterward. Either structure works provided the connection between your research questions and your findings is traceable; check your research manual’s own convention before choosing.
Build your qualitative Chapter 4 with the right format for your data
Tesify helps you structure theme-and-verbatim tables, participant profile tables and the interpretive prose around them from your own coded data rather than a generic template. Over 9,000 students have used it to write more than 15,000 chapters, and every word is still written by you.