| Instrument | What it measures | Best for | Where it falls short |
|---|---|---|---|
| SERVQUAL (Parasuraman, Zeithaml & Berry, 1988) | Gap between expected and perceived service quality across five dimensions: tangibles, reliability, responsiveness, assurance, empathy | Hotel, resort, restaurant or tour operator service-quality theses | The expectation-perception “gap score” format is long (44 items) and respondents find the paired format repetitive |
| SERVPERF (Cronin & Taylor, 1992) | Perceived performance only, on the same five SERVQUAL dimensions, without a separate expectation section | The same service-quality studies as SERVQUAL, where a shorter instrument is needed | Drops the expectation-gap logic some advisers specifically want to see discussed |
| Destination Image Scale — cognitive-affective model (Baloglu & McCleary, 1999) | How a place is perceived (cognitive attributes: safety, attractions, value) and felt (affective: pleasant, arousing, relaxing) | Destination marketing, tourism branding, revisit-intention theses | Needs adaptation of attribute items to the specific destination; a generic item list rarely fits a Philippine LGU or resort area unmodified |
| Destination Image tripartite model (Echtner & Ritchie, 1991/1993) | Functional-psychological and holistic-attribute dimensions of destination image, including unique versus common characteristics | Comparative destination image or destination positioning studies | The open-ended holistic component needs qualitative coding, adding analysis time a purely quantitative thesis may not budget for |
| Researcher-made questionnaire | Whatever constructs the researcher defines, built for the specific local context | A tourism topic with no validated instrument that fits — a niche typology, a very specific local practice, an emerging trend | Needs its own pilot testing and reliability check before use; panels ask for the Cronbach’s alpha from your own pilot, not a borrowed figure |
Which instrument should a tourism or hospitality thesis use?
Use SERVQUAL or its shorter SERVPERF variant for any service-quality study — a hotel’s front-desk service, a resort’s amenities, a tour operator’s guiding — and use a destination image scale for any study about how a place, not a single business, is perceived or marketed. Reserve a fully researcher-made questionnaire for the minority of topics neither instrument covers, and only after a pilot test establishes its reliability. The three are not interchangeable: SERVQUAL measures a specific transaction’s service quality, destination image measures a place’s overall perception, and a custom instrument measures whatever construct the researcher defines from scratch — mismatching the instrument to the actual research question is one of the fastest ways a Chapter 3 gets sent back.
1. SERVQUAL and SERVPERF: for measuring a business’s service quality
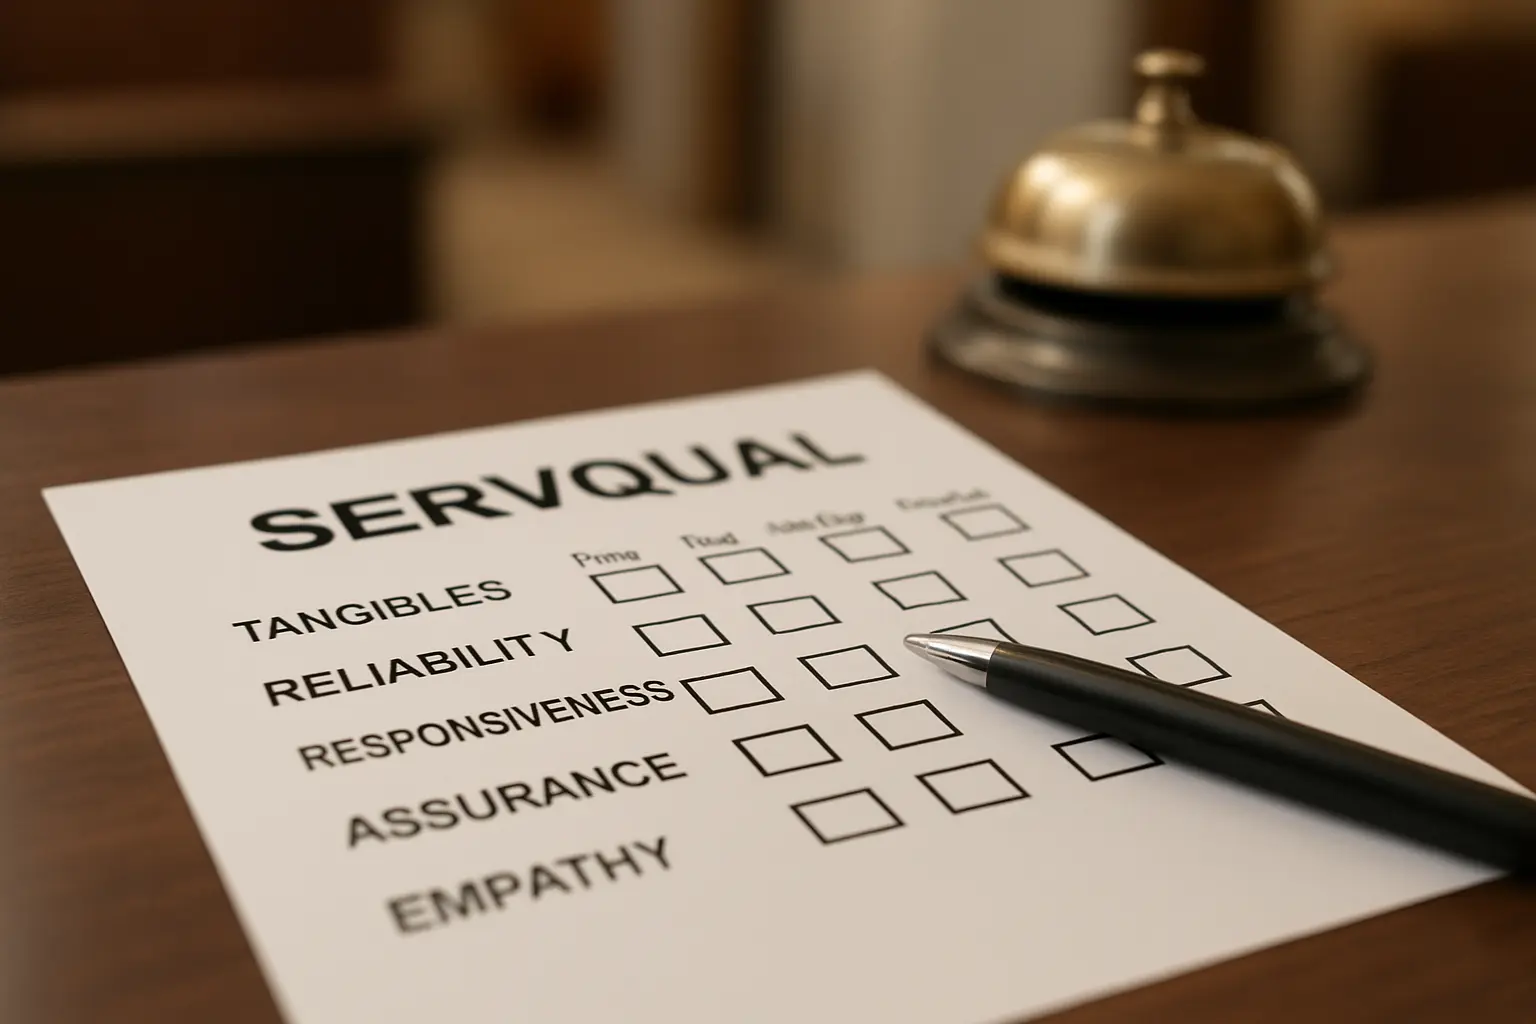
SERVQUAL, developed by Parasuraman, Zeithaml and Berry in 1988, measures service quality as the gap between what a customer expects and what they actually perceive, across five dimensions: tangibles (physical facilities and appearance of staff), reliability (performing the promised service dependably), responsiveness (willingness to help promptly), assurance (staff knowledge and the trust it inspires) and empathy (individualised attention to the customer). The original instrument pairs 22 expectation items with 22 matching perception items — 44 items total — which is thorough but long for a Philippine survey where respondents are often approached in person at a hotel lobby or restaurant with limited time.
SERVPERF, proposed by Cronin and Taylor in 1992, keeps the same five dimensions and the same 22 core items but drops the separate expectation section, asking only about perceived performance. For a BS Tourism Management or BS Hospitality Management thesis where the goal is simply to measure and rank service quality across dimensions rather than to analyse the expectation-perception gap itself, SERVPERF is the shorter and increasingly the more common choice — check with the adviser first, since some research manuals still specifically want the gap-score discussion SERVQUAL enables.
2. Destination image scales: for measuring how a place is perceived
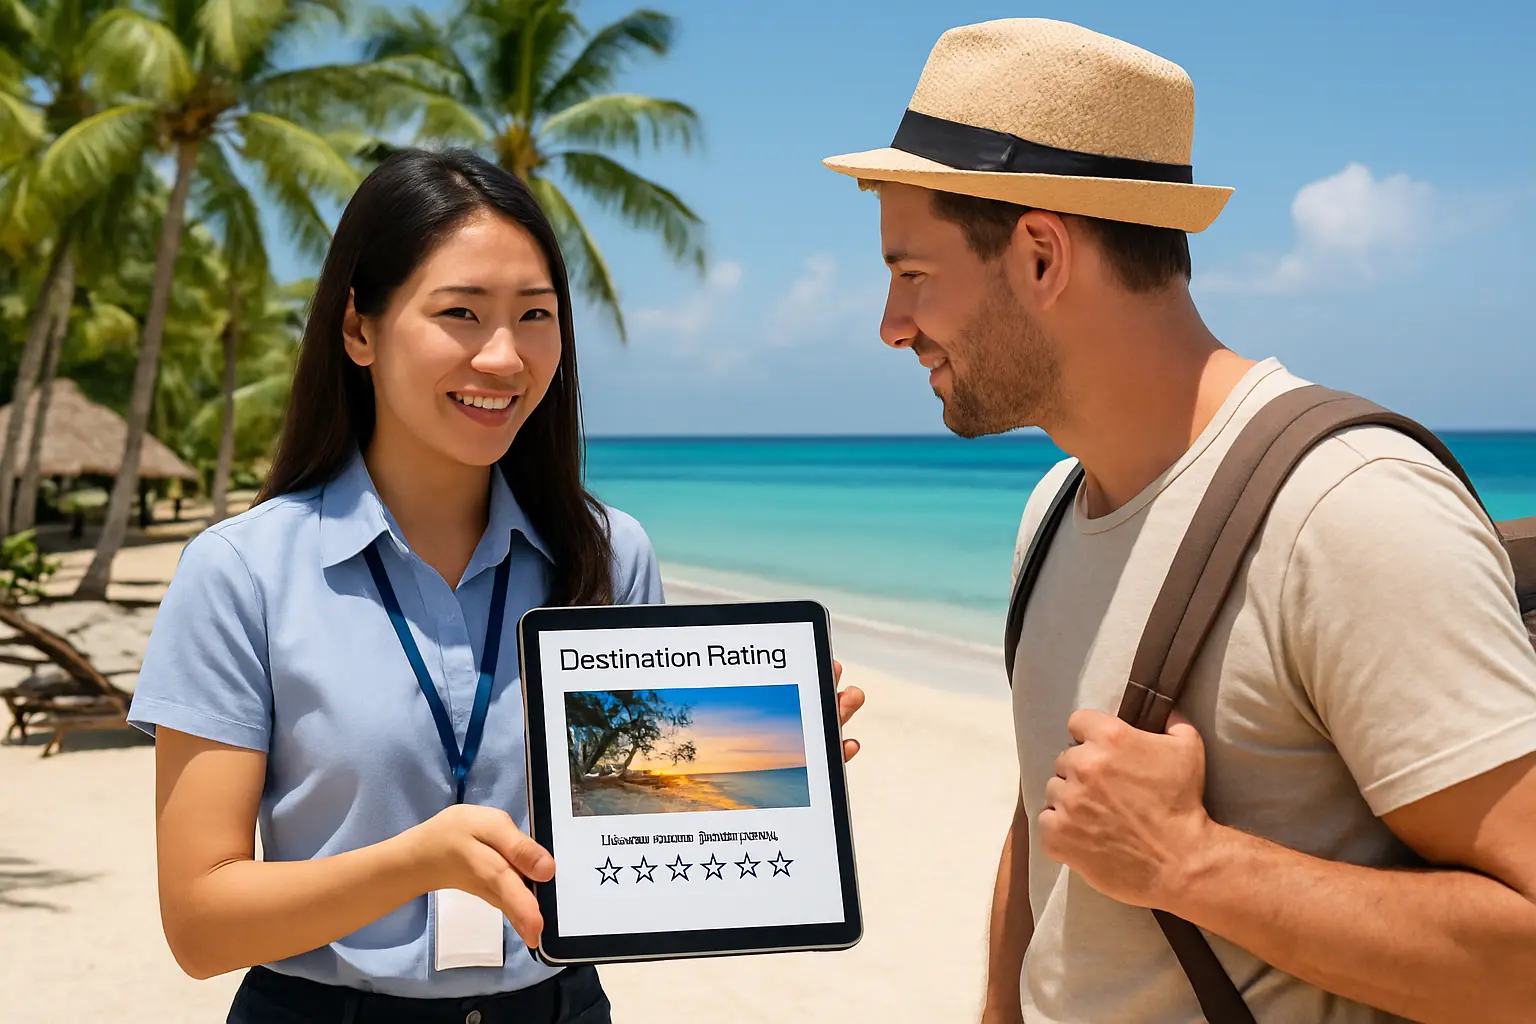
Where SERVQUAL measures a single business transaction, a destination image scale measures how tourists perceive an entire place — a province, a city, a specific tourism zone. The Baloglu and McCleary (1999) cognitive-affective model splits destination image into a cognitive component (beliefs about attributes such as safety, natural attractions, value for money) and an affective component (the feelings a destination evokes, typically measured on semantic-differential scales such as pleasant-unpleasant or exciting-gloomy), then models how the two combine into an overall image. The Echtner and Ritchie (1991; 1993) tripartite framework instead crosses functional-psychological and common-unique dimensions, and typically pairs a structured attribute checklist with an open-ended question asking respondents to describe the destination in their own words — useful when a thesis wants to capture image elements a fixed checklist would miss, at the cost of extra qualitative coding work later.
Neither destination image instrument transfers to a new destination without adaptation: the specific attractions, safety concerns and value propositions of a Philippine beach town are not the same as a European city’s, so the attribute list has to be rebuilt around the actual destination being studied, with the underlying dimensions (cognitive and affective, or functional and holistic) kept intact from the original model. The theory-to-variable discipline behind adapting an instrument this way is the same one covered in what theoretical framework a BEEd or BSEd education thesis should use — the framework has to actually explain the variables being tested, not just lend its name to the study.
3. When a researcher-made questionnaire is the right call
A validated instrument does not exist for every tourism topic — a very specific local festival’s economic impact on vendors, a niche adventure-tourism segment, an emerging practice such as staycation booking behaviour — and forcing SERVQUAL or a destination image scale onto a study it was not built for produces a mismatch the panel will notice immediately. In that case, a researcher-made questionnaire is the correct choice, but it comes with its own obligations: a clear operational definition for every construct, a pilot test with a small sample separate from the main study, and a reliability statistic — commonly Cronbach’s alpha, reported from the researcher’s own pilot data, not borrowed from another study — before the instrument is used for actual data collection. Where the questionnaire also needs redesign after a low pilot response or unclear items, the same fix-in-Chapter-3-before-fieldwork discipline applies as with any thesis instrument, described in what to do when a Chapter 3 sampling plan is still missing close to the deadline.
How much does administering these instruments cost a thesis group?
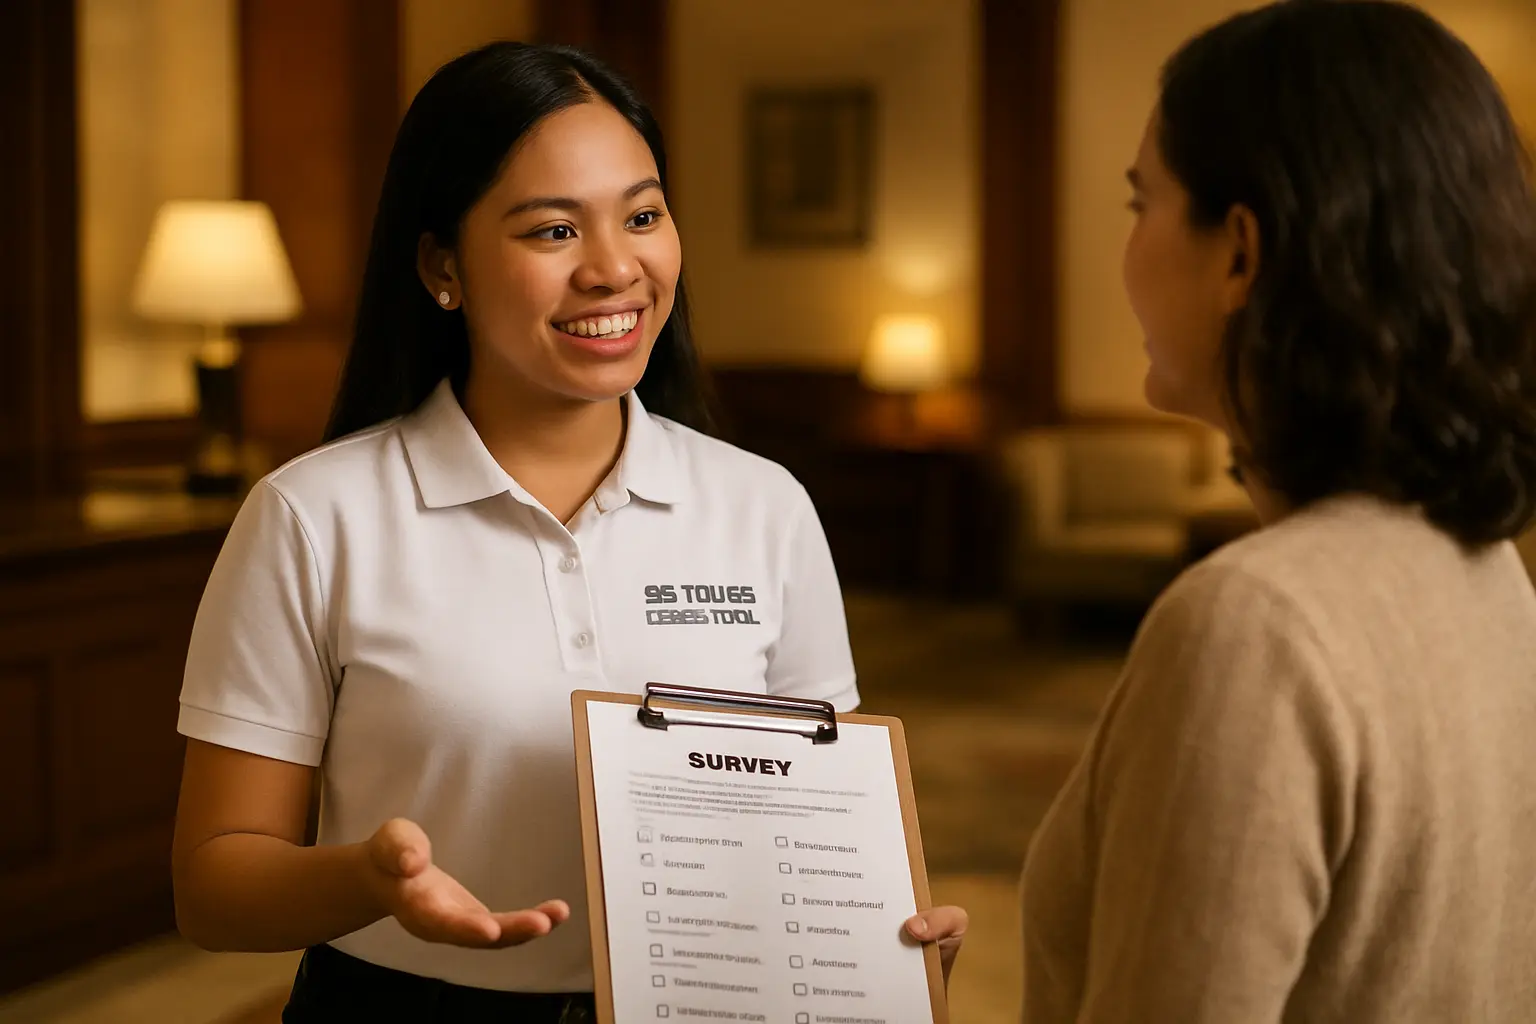
None of the three instruments themselves cost anything to use academically, but administering them does cost real pesos and time, and a thesis group splitting the load should plan for it. Printing 100 to 150 copies of a 44-item SERVQUAL form runs noticeably higher than the shorter SERVPERF or a well-scoped destination image scale, simply on page count; a group intercepting hotel guests or tourists in person also needs travel budget to the site and, often, a small token of appreciation for respondents’ time. Distributing the same instrument as a Google Form removes the printing cost entirely and lets group members split data collection across different days without meeting in person, at the cost of skewing the sample toward respondents who are comfortable with a phone or laptop — a trade-off covered in more depth in Google Forms vs Microsoft Forms vs paper for collecting thesis data. For an in-person tourism-site intercept survey, a mixed approach — paper for older or less digitally comfortable respondents, a QR code linking to the same Google Form for everyone else — often collects the fullest sample for the lowest combined cost.
How do you decide, in practice?
Ask what the unit of analysis actually is. If it is a single business’s service delivery, SERVQUAL or SERVPERF fits. If it is an entire destination’s perceived image, use a destination image scale, adapted to the place. If neither construct matches the research question, build a researcher-made instrument and budget real time for piloting it — a validated scale used correctly beats a custom instrument, but a custom instrument built and piloted properly beats a validated scale forced onto the wrong construct. Whichever instrument is chosen, its dimensions should already be visible in the conceptual framework built in how to make a thesis conceptual framework, so the instrument and the framework are never built as two separate, disconnected exercises.
Match your topic to the right instrument, adapted to your setting
Tesify drafts the instrumentation section of Chapter 3 from the tourism or hospitality topic you describe, recommending SERVQUAL, SERVPERF or a destination image scale where one fits, and helping build and structure a researcher-made questionnaire with a pilot-testing plan where none does. Over 9,000 students have used it to write more than 15,000 chapters, and every word is still written by you.
Frequently asked questions
Can I use SERVQUAL for a destination-level study instead of a single business?
Not directly — SERVQUAL’s dimensions are built around a specific service transaction, not an entire place’s perceived image. A destination-level study needs a destination image scale, or a custom instrument if the study is about something neither covers, such as destination competitiveness against named alternatives.
Do I need permission to use SERVQUAL or a destination image scale?
Academic use for a thesis, with proper citation to the original authors, is standard practice and does not typically require separate permission; check your specific research manual, since a small number of schools ask for a formal citation of the licensing terms where the instrument’s publisher specifies them.
How many items should my adapted destination image scale have?
Enough to cover the cognitive attributes relevant to the specific destination (commonly 15 to 25 items) plus the affective semantic-differential items (commonly four to six pairs); trim attributes that do not apply to the destination rather than keeping the full original list unmodified.
What statistical test do I use with SERVQUAL data?
Gap scores (perception minus expectation) per dimension are commonly compared using paired t-tests or by ranking mean gap scores across dimensions; the exact test depends on the hypotheses stated in Chapter 1 and the resulting scale of measurement, following the same test-selection logic covered in what statistical treatment of data a thesis needs. Whether that analysis runs in SPSS or a spreadsheet is a separate decision, weighed in SPSS vs Excel for thesis statistics.
Can I combine SERVQUAL with a destination image scale in the same thesis?
Yes, where the study genuinely covers both a specific business’s service quality and the wider destination’s image, but each instrument should be justified separately in the framework, and the added length and analysis burden of running two instruments should be weighed against the timeline.
Is a researcher-made questionnaire less rigorous than a validated scale?
Not if it is properly piloted and its reliability reported. A validated scale used on the wrong construct is less rigorous than a well-piloted custom instrument used on the right one; validity to the research question matters more than the instrument’s pedigree.
Where do I find the original SERVQUAL or destination image scale items?
The original journal articles — Parasuraman, Zeithaml and Berry (1988) in the Journal of Retailing for SERVQUAL, and Baloglu and McCleary (1999) in the Annals of Tourism Research for the cognitive-affective model — list the full item sets; access them through your school’s library database rather than an unverified secondary source.