
The statistical treatment of data is the section of Chapter 3 that names, for every problem in your statement of the problem, the exact statistical tool used to answer it and the decision rule applied to the result. It is a mapping of problems to tools. It is not a discussion of statistics in general, and it is not a list of software.
Why does this section exist at all?
Because a panel needs to know, before it reads your results, that you chose your analysis for a reason. A Chapter 3 that ends with “the data were analysed using SPSS” tells them nothing: SPSS will happily run a t-test on data that needed a chi-square.
The section is short, usually one paragraph or a small table, and it is disproportionately valuable. It is where a panelist looks first when a Chapter 4 finding looks wrong, and it is where an adviser looks to check that your study is internally coherent before it goes anywhere near a defense.
What does a correct statistical treatment section actually look like?
Like this, and rarely longer:
“Frequency and percentage were used to describe the profile of the respondents under Problem 1. Weighted mean was used to determine the level of X and Y under Problems 2 and 3, with a criterion mean of 2.50. Pearson’s r was used to determine the relationship between X and Y under Problem 4, tested at the 0.05 level of significance. All computations were performed using SPSS version 27.”
Four features make it correct. Every problem is named. Every problem has exactly one tool. The decision rules — the criterion mean and the level of significance — are stated as numbers. And the software is named last, as a footnote rather than as the answer.
Which tool answers which kind of problem?
Almost every Philippine undergraduate SOP is built from five kinds of problem. Match them like this.
| What the problem asks | Typical SOP wording | Statistical tool |
|---|---|---|
| Who are the respondents? | “What is the profile of the respondents in terms of…” | Frequency and percentage |
| How much of something is there? | “What is the level of…” / “What is the extent of…” | Weighted mean (with standard deviation) |
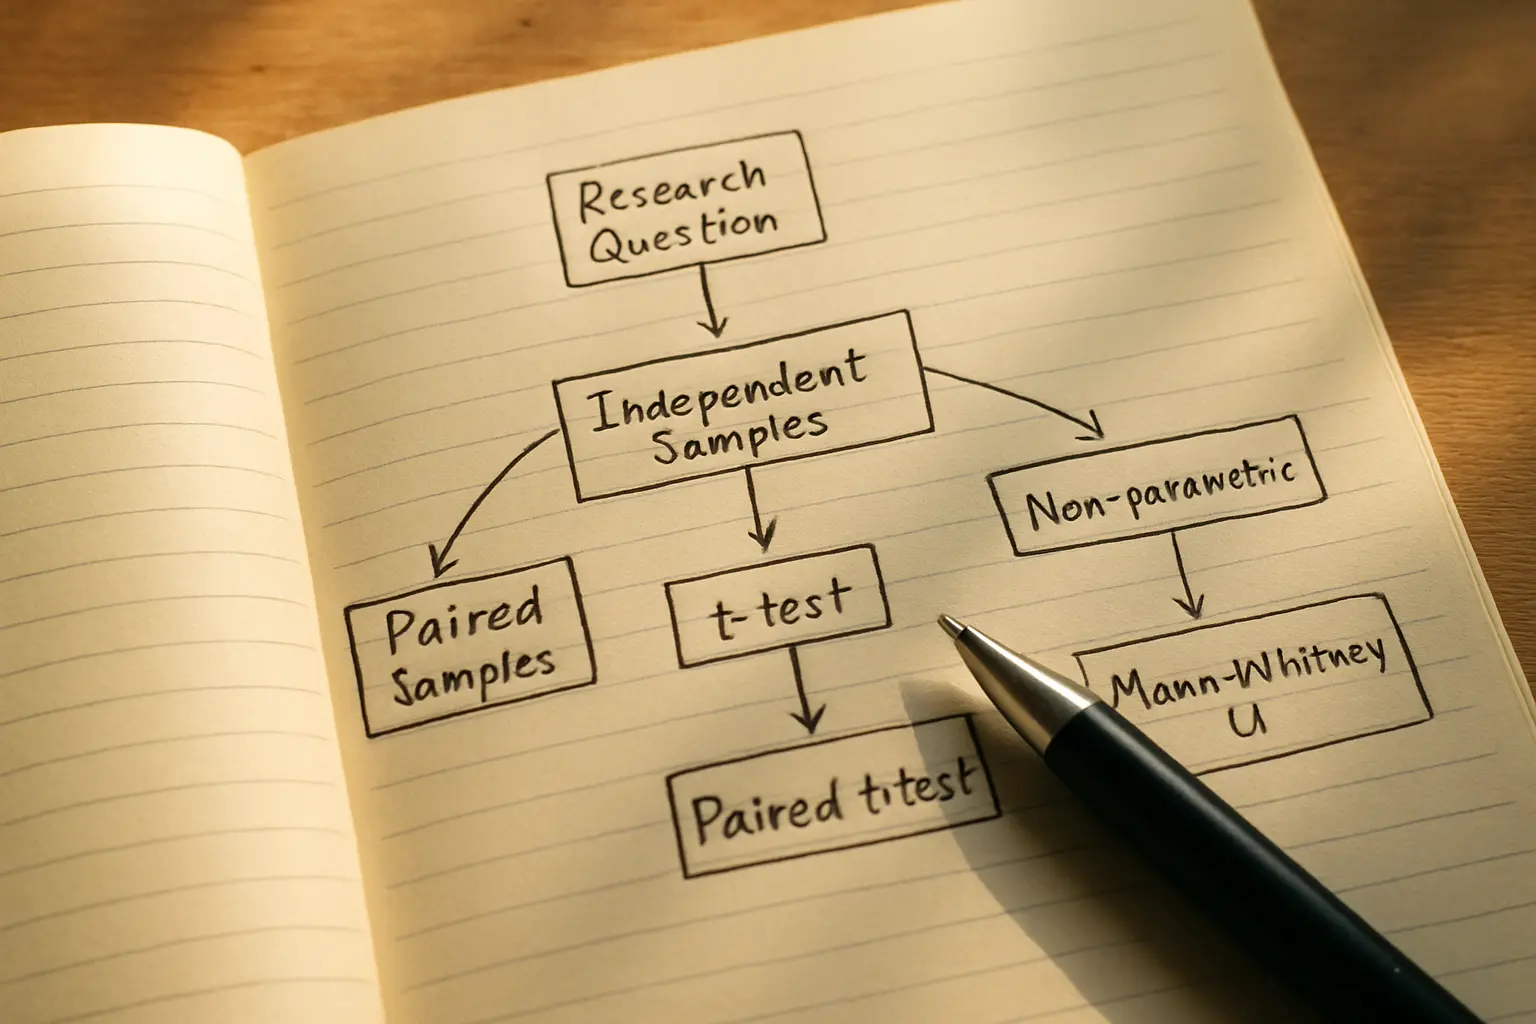
| Do two groups differ? | “Is there a significant difference between…” | t-test (two groups) or ANOVA (three or more) |
| Are two variables related? | “Is there a significant relationship between…” | Pearson’s r, Spearman’s rho, or chi-square |
| Does one variable predict another? | “To what extent does X predict Y?” | Regression analysis |
The choice within the relationship row is the one students most often get wrong, so it is worth spelling out. Use Pearson’s r when both variables are interval or ratio and approximately normally distributed. Use Spearman’s rho when either variable is ordinal, such as a ranking, or when the distribution is not normal. Use chi-square when both variables are categorical, such as sex against programme.
The same care applies to the difference row. A t-test compares exactly two groups. Three or more groups needs ANOVA, and running three separate t-tests instead is a well-known error that inflates your chance of a false positive.
What is the weighted mean and how do you compute it?
The weighted mean is the average response to a Likert item, weighted by how many respondents chose each option. It is the workhorse of Philippine undergraduate theses because most instruments are Likert-scaled.
The formula is WM = Σ(fw) / n, where f is the frequency of each response, w is its weight and n is the total number of respondents.
Worked example. On a four-point scale, for one item answered by 100 respondents: 40 chose Strongly Agree (4), 35 chose Agree (3), 15 chose Disagree (2) and 10 chose Strongly Disagree (1).
- Σ(fw) = (40 × 4) + (35 × 3) + (15 × 2) + (10 × 1) = 160 + 105 + 30 + 10 = 305.
- WM = 305 ÷ 100 = 3.05.
Report the weighted mean to two decimal places, and report the standard deviation alongside it if your manual asks for it. A mean of 3.05 with a standard deviation of 0.40 describes a very different group from a mean of 3.05 with a standard deviation of 1.20, and a panel may ask which you have.
What is a criterion mean, and where do the interpretation ranges come from?
The criterion mean is the cut-off that separates a favourable interpretation from an unfavourable one. On a four-point scale it is conventionally 2.50, the midpoint between 1 and 4. A weighted mean at or above 2.50 is interpreted as agreement; below it, as disagreement.
The verbal interpretation ranges are derived, not invented. Take the range of the scale and divide by the number of options: (4 − 1) ÷ 4 = 0.75. That 0.75 is the width of each band.
| Range | Verbal interpretation (four-point scale) |
|---|---|
| 3.26 – 4.00 | Strongly Agree |
| 2.51 – 3.25 | Agree |
| 1.76 – 2.50 | Disagree |
| 1.00 – 1.75 | Strongly Disagree |
Our worked mean of 3.05 therefore falls in the 2.51–3.25 band and is interpreted as “Agree”. Show the 0.75 derivation in your chapter if your adviser asks where the bands came from; students who cannot explain it are usually copying a table from another thesis.
If your instrument uses a five-point scale, the arithmetic changes: (5 − 1) ÷ 5 = 0.80, and the criterion mean becomes 3.00. Do not import four-point bands into a five-point instrument.
What does the level of significance actually mean?
It is the threshold at which you decide a result is unlikely to be due to chance alone. Philippine undergraduate theses almost universally use 0.05.
The decision rule follows mechanically: if the computed p-value is less than or equal to 0.05, reject the null hypothesis and conclude there is a significant relationship or difference. If it is greater than 0.05, fail to reject the null hypothesis.
Two points of precision that panels test. First, you fail to reject a null hypothesis; you never “accept” or “prove” it. Second, a significant result is not the same as a large or important one — with a big enough sample, a trivially small correlation can be statistically significant. Say what the size of the effect means in practice, not just whether it cleared 0.05.

Does the statistical treatment change if my study is qualitative?
Yes, completely. A purely qualitative study has no statistical treatment in the usual sense; it has a data analysis section describing thematic analysis, coding procedure, and how themes were validated. Some manuals still title the section “Statistical Treatment of Data”, which forces qualitative students into an awkward heading — write the analysis honestly under whatever heading your manual requires rather than manufacturing statistics you did not compute.
A mixed-methods study needs both, with each strand’s analysis stated separately and the point of integration named. If you have not yet decided which route your study takes, decide before you write this section, because it determines everything in it — the trade-offs are in the guide to quantitative versus qualitative research.
Which software should you name, and does it matter?
Name the one you actually used. SPSS is the default in most Philippine departments, Excel is entirely adequate for frequency, percentage, weighted mean and even t-tests, and free options exist for students who cannot access a licence. A panel does not usually care which you used; it cares that you can reproduce the computation if asked. The trade-offs, including what Excel can and cannot do without an add-in, are covered in the comparison of SPSS and Excel for thesis statistics.
Keep your output file. “Show us your SPSS output” is a reasonable request and it is embarrassing not to have it.
Where does this section sit in the chapter?
Last, after the data gathering procedure. It closes Chapter 3 and hands over to Chapter 4, where every tool you named here must actually appear. The rest of the chapter, section by section with filled-in template text, is in the guide to writing Chapter 3, and the way the five chapters connect is summarised in the overview of Chapters 1 to 5.
Run one final check before you submit: count the problems in your SOP, count the tools in this section, and make the two numbers match. A problem with no tool is a problem that will never be answered, and it is one of the defects panels find fastest.
Get Chapter 3 written while your data is still fresh
Tesify structures your methodology chapter in the order your research manual expects, keeps every citation attached to a source you actually read, and leaves the decisions about design, sample and analysis with you. Over 9,000 students have used it to write more than 15,000 chapters, and every word is still written by you.
Frequently asked questions
What is the statistical treatment of data in a thesis?
It is the Chapter 3 section that names, for each problem in your statement of the problem, the specific statistical tool used to answer it and the decision rule applied. It maps problems to tools; it does not explain statistics in general.
How do I compute the weighted mean?
WM = Σ(fw) ÷ n. Multiply each response frequency by its scale weight, add the products, and divide by the number of respondents. Report it to two decimal places.
What is the criterion mean on a four-point scale?
2.50, the midpoint between 1 and 4. A weighted mean at or above it is interpreted as agreement. On a five-point scale the criterion mean is 3.00.
Where do the Likert interpretation ranges come from?
From the scale range divided by the number of options. On a four-point scale, (4 − 1) ÷ 4 = 0.75, giving bands of 1.00–1.75, 1.76–2.50, 2.51–3.25 and 3.26–4.00.
When should I use Pearson’s r instead of Spearman’s rho?
Use Pearson’s r when both variables are interval or ratio and approximately normal. Use Spearman’s rho when either variable is ordinal or the distribution is not normal.
When do I use ANOVA instead of a t-test?
A t-test compares two groups. Use ANOVA for three or more. Running multiple t-tests instead inflates the risk of a false positive and panels know it.
What does a p-value of 0.05 mean?
It is the threshold for deciding a result is unlikely to be due to chance. A computed value at or below 0.05 leads you to reject the null hypothesis; above it, you fail to reject.
Can I say I accepted the null hypothesis?
No. The correct wording is that you failed to reject it. Failing to find evidence of a difference is not evidence that no difference exists, and this is a wording error panels correct routinely.
Do I need to report the standard deviation?
Follow your manual, but report it if you can. Two groups can share a mean and differ completely in spread, and the standard deviation is what tells your reader which situation you have.
What if my adviser asks for a tool I have never used?
Ask them to name the specific test and the reason it fits the problem, then learn that one test rather than all of them. Advisers usually have a concrete reason, and the reason is what you will need to give in the defense.