
Chapter 4 is the chapter students most often write backwards. They open SPSS, export everything it produced, paste the output into the document, and then try to write sentences around it. The result is a chapter with fourteen tables, nine of which answer no question anybody asked, and a panel that spends the defence hunting for the finding.
Chapter 4 is written one table at a time, in the order of your statement of the problem, and nothing else goes in it. This guide walks that procedure in seven steps, with a filled-in APA 7th table you can copy, the three-move interpretation paragraph Philippine panels expect under every table, and the numeric conventions APA itself publishes.
One caution first: your school’s research manual outranks everything below. Manuals at UP Diliman, Ateneo de Manila, De La Salle and UST differ on table numbering, on whether discussion is merged into Chapter 4 or split into Chapter 5, and on whether the verbal interpretation column is required.
Step 1: Rebuild the chapter outline from your statement of the problem
Expected output: a numbered sub-section list that matches your SOP one-for-one, written before you touch any output.
- Open Chapter 1 and copy out your specific problems, in order, exactly as worded.
- Give each one its own sub-section heading in Chapter 4, in the same order and with the same numbering.
- Under each heading, write in pencil which single table will answer it and which statistical tool produced that table.
- Delete every piece of output that did not get assigned to a heading.
That last instruction is the one that saves the chapter. If your SOP has four problems, Chapter 4 has four sub-sections and, in most undergraduate studies, four to six tables. A fifth table that answers no problem is not a bonus; it is an invitation for a panellist to ask why you ran it.
The mapping from problem type to statistical tool is the same one you declared at the end of Chapter 3, and if you have not settled it yet, it is set out in full in the guide to the statistical treatment of data in a thesis. Chapter 4 must use exactly the tools you named there — no more, and none substituted quietly.
Step 2: Fix the N before you build a single table
Expected output: one number, written at the top of your working file, that will not change again.
Your analysed N is the number of completely accomplished instruments, not the number distributed and not the number returned. Chapter 3 already states all three; Chapter 4 uses only the third.
Template for the opening paragraph of the chapter: “This chapter presents the data gathered, the analysis of the data and the interpretation of the findings. Of the 344 questionnaires distributed, 331 were retrieved and 326 were completely accomplished and used in the analysis. The findings are presented in the order of the specific problems stated in Chapter 1.”
Then hold that number everywhere. The single most common defect Philippine panels find is a respondent count that reads 326 in Chapter 3, 331 in a Chapter 4 table header and 330 in the abstract. It takes a panellist ten seconds and it puts every other number in the manuscript in doubt. The procedure that produced those three figures belongs in Chapter 3, not here.
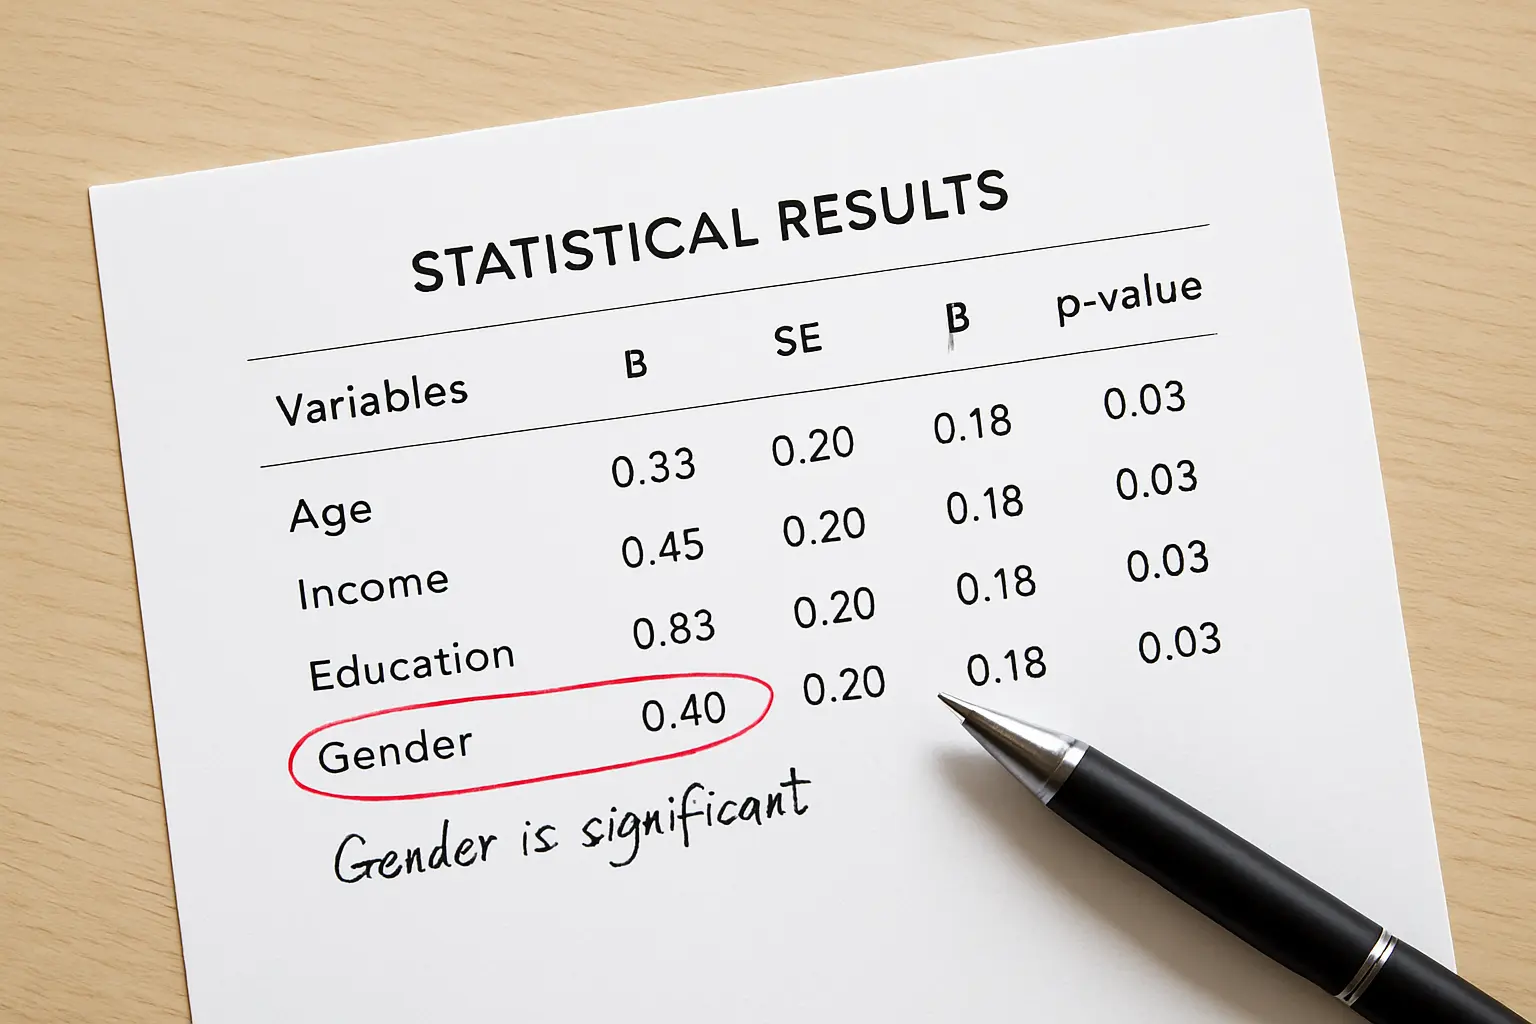
Step 3: Build the table before you write the paragraph
Expected output: a finished table, correctly numbered and titled, before any prose exists for that sub-section.
Writing the paragraph first produces prose that describes a table you have not built and then does not match it. Build the table, read it, then write.
An APA 7th table has a specific anatomy, and Philippine manuals that say “APA format” mean this one. The table number goes on its own line in bold. The title goes on the next line in italics, in title case, and it is a description rather than a sentence. Then the table, then any notes beneath it.
Worked example — a weighted mean table answering a “level of” problem:
Table 3
Level of Perceived Workplace Competency Transfer Among Fourth-Year Business Students
| Indicator | M | SD | Verbal Interpretation | Rank |
|---|---|---|---|---|
| Applies classroom concepts to workplace tasks | 3.4 | 0.6 | Strongly Agree | 1 |
| Communicates effectively with supervisors | 3.2 | 0.7 | Agree | 2 |
| Adapts to unfamiliar workplace procedures | 3.1 | 0.7 | Agree | 3 |
| Resolves problems without direct supervision | 2.6 | 0.9 | Agree | 4 |
| Overall | 3.1 | 0.7 | Agree | — |
Note. N = 326. Scale: 3.26–4.00 Strongly Agree; 2.51–3.25 Agree; 1.76–2.50 Disagree; 1.00–1.75 Strongly Disagree.
Three things that table does deliberately. It carries the standard deviation next to every mean, because a mean of 3.1 with an SD of 0.7 describes a different group from a mean of 3.1 with an SD of 1.4, and a panel may ask which you have. It states the interpretation bands in the note rather than assuming the reader knows where they came from. And it reports the means to one decimal place, which is what APA specifies for data measured on an integer scale such as a Likert questionnaire — a rule almost every Philippine thesis gets wrong in the direction of two or three decimals.
Step 4: Write the three-move interpretation paragraph
Expected output: one paragraph per table, three sentences minimum, none of which repeats a number the table already shows more than once.
The paragraph under a table is not a reading of the table. If your prose says “as shown in Table 3, the mean for the first indicator was 3.4, the second was 3.2, the third was 3.1”, you have retyped the table and said nothing. APA’s own guidance is blunt about this: do not repeat statistics in both the text and a table or figure.
- State the finding. The highest and lowest values, and the overall picture, in one sentence.
- Say what it means in your setting. Not in general — in your locale, for your respondents, in the terms of the problem you posed.
- Connect it to Chapter 2. One named study that your finding agrees or disagrees with, and a word on why.
Worked paragraph, built from Table 3:
“Respondents rated the direct application of classroom concepts highest (M = 3.4) and independent problem-solving lowest (M = 2.6), with an overall level interpreted as Agree. The pattern suggests that the on-the-job training placements in the College transfer content knowledge more successfully than they transfer autonomy, which is consistent with the sequencing of the programme’s practicum: students are supervised closely throughout the first placement and rarely allocated independent tasks. Santos and Cruz (2024) reported the same ordering among business graduates in a comparable urban setting, although the gap between the two indicators in the present study is wider.”
Notice that the paragraph reuses only two numbers, both of which carry the argument, and that the third sentence points at a study a panellist can look up in your review of related literature. A Chapter 4 whose paragraphs never mention Chapter 2 is the commonest reason a panel says the study “does not discuss”.
Note also the APA convention that the worked paragraph follows: the ampersand appears inside parentheses, the word “and” outside them, so it is Santos and Cruz (2024) in narrative position and (Santos & Cruz, 2024) in parenthetical position. That single distinction is the most common APA error in Philippine manuscripts.
Step 5: Report each inferential test in the sentence a panel expects
Expected output: for every hypothesis, one sentence containing the statistic, its degrees of freedom, its value, the exact p, and the decision.
Descriptive tables are the easy half. The sub-sections answering “is there a significant difference” or “is there a significant relationship” have a fixed reporting shape, and panels test it because it is short enough to check.
Correlation: “A significant positive relationship was found between competency transfer and academic performance, r(324) = .42, p < .001. The null hypothesis is therefore rejected.”
Independent-samples comparison: “Male and female respondents did not differ significantly in perceived competency transfer, t(324) = 1.28, p = .20. The null hypothesis is not rejected.”
Test of independence: “Programme major and placement type were significantly associated, χ²(3, N = 326) = 12.71, p = .005.”
Two wordings a panel will correct on the spot. You fail to reject a null hypothesis; you never accept it and you never prove it. And a significant result is not automatically a large or important one, so the sentence after the test should say what the size of the relationship means in practice rather than treating .05 as the end of the discussion.
Which of these three sentences you need depends on which test answers your problem, and that decision is made in Chapter 3 rather than here. If you are still deciding how to produce the numbers, the trade-offs are in the comparison of SPSS and Excel for thesis statistics.

Step 6: Apply APA’s numeric conventions, which are narrower than you think
Expected output: a pass over every number in the chapter against the six rules below, taken from the APA Style Numbers and Statistics Guide, the free instructional aid published alongside the seventh-edition manual and last updated in September 2024.
- Decimal places. Means and standard deviations from integer scales — that is, from your Likert questionnaire — are reported to one decimal. Other means and standard deviations, correlations, proportions and inferential statistics such as t, F and chi-square are reported to two.
- Leading zeros. Put a zero before the decimal point only when the statistic can exceed 1. It cannot for a proportion, a correlation or a significance level, so write r = .42 and p = .03, never 0.42 or 0.03.
- Exact p values. Report p to two or three decimals — p = .006, p = .03 — except when it falls below .001, where you write p < .001 and nothing more precise.
- Numerals versus words. Use numerals for 10 and above and for every number used in a statistic; use words for zero through nine and for any number that opens a sentence.
- Symbols and abbreviations. Use the symbol when it sits with a mathematical operator (M = 3.1) and the word when it does not. Statistical letters are italic; Greek letters are not. Never define M, SD, N, n, t, df or p — but do define ANOVA, CI and any model abbreviation you introduce.
- Spacing. There is a space either side of a mathematical operator, and a space before but not after a minus sign on a negative value.
None of this is decoration. A methodology chapter can be argued about; a decimal place cannot, and a panel that finds three of these in the first two pages reads the rest of the chapter differently.
Step 7: Run the four reconciliation checks before you submit
- Problems equal sub-sections. Four specific problems in Chapter 1, four sub-sections in Chapter 4, in the same order and the same wording.
- Tools equal tables. Every tool named in your statistical treatment section produces at least one table here, and no table appears from a tool you never named.
- One N everywhere. Chapter 3, every Chapter 4 table note, and the abstract carry the same respondent count.
- Every table is mentioned. Each table is referred to by number in the text at least once, and no table is left to speak for itself.
Then read the chapter once for a final structural test: can you state each finding in a single spoken sentence without looking at the page? That is exactly what a panel will ask you to do, and the whole architecture of the five chapters is designed so that you can. How they fit together is summarised in the overview of Chapters 1 to 5, and if the alignment of problems and objectives upstream is shaky, fix it in Chapter 1 before rewriting anything here.
Turn your output into a chapter your panel can read
Tesify holds your chapter structure in the order your research manual expects, keeps every citation attached to a source you actually opened, and lets you write the interpretation of your own tables instead of fighting the formatting. Over 9,000 students have used it to write more than 15,000 chapters, and every word is still written by you.
Frequently asked questions
How do I write Chapter 4 of a thesis?
Build one sub-section per specific problem, in the order of your statement of the problem. Under each, place one table, then a paragraph that states the finding, explains what it means in your setting, and compares it with a study from Chapter 2. Nothing that answers no problem goes in the chapter.
How many tables should Chapter 4 have?
Roughly one per specific problem, sometimes two where a problem has several sub-parts. Most Philippine undergraduate theses land between four and eight. Fourteen tables usually means SPSS output was pasted in rather than selected.
Should results and discussion be in the same chapter?
Follow your research manual. Many Philippine programmes title the chapter “Presentation, Analysis and Interpretation of Data” and keep the discussion with each table, reserving Chapter 5 for summary, conclusions and recommendations. Others separate them. Both are normal; mixing the two conventions in one manuscript is not.
How many decimal places should I use?
One for means and standard deviations taken from an integer scale such as a Likert questionnaire, two for correlations and for inferential statistics, and two or three for an exact p value. Below .001, write p < .001.
Do I write 0.05 or .05?
.05. A significance level cannot exceed 1, so it takes no leading zero. The same applies to correlations and proportions, but not to a mean, which can exceed 1 and therefore keeps its zero.
Can I say I accepted the null hypothesis?
No. Write that you failed to reject it. Not finding evidence of a difference is not evidence that no difference exists, and this is corrected in almost every defence where it appears.
Do I need to repeat the numbers from the table in the paragraph?
No, and APA specifically advises against reporting the same statistics in both a table and the text. Quote only the one or two figures your argument turns on, and let the table carry the rest.
What if one of my findings contradicts the literature?
Report it plainly and give a reason grounded in your setting — a different population, a different period, a smaller sample, a different instrument. A contradicted finding that is explained is a contribution. A contradicted finding that is quietly omitted is a defect a panel finds by reading Chapter 2.
Where do the recommendations go?
Chapter 5, not here. Chapter 4 reports and interprets what the data showed. The moment you start telling the College what it ought to do, you have crossed into the next chapter.
My adviser says my discussion is too thin. What is missing?
Almost always the third move: the comparison with a named study. Go back to your synthesis of related literature, find the two or three studies that measured something close to what you measured, and place one under each table.