
The Philippines has 7.14 fixed broadband subscriptions per 100 people and 115.30 mobile cellular subscriptions per 100 — so for most Filipino students the internet is a phone on metered data, not a connection at home.
That single contrast is the most useful connectivity fact you can put in a Chapter 1, and it is the one most theses miss because they quote a national internet-penetration percentage and stop there.
Every figure below was read directly from the World Bank indicator API on 18 August 2026. The series carried a lastupdated stamp of 13 July 2026, which is the date you should cite alongside any of these numbers.
The headline figures
| Indicator | Latest value | Year | Source |
|---|---|---|---|
| Individuals using the internet (% of population) | 67.26% | 2024 | World Bank, IT.NET.USER.ZS (updated 13 Jul 2026) |
| Mobile cellular subscriptions (per 100 people) | 115.30 | 2024 | World Bank, IT.CEL.SETS.P2 (updated 13 Jul 2026) |
| Fixed broadband subscriptions (per 100 people) | 7.14 | 2024 | World Bank, IT.NET.BBND.P2 (updated 13 Jul 2026) |
| School enrolment, tertiary (% gross) | 47.41% | 2024 | World Bank, SE.TER.ENRR (updated 13 Jul 2026) |
Note what the second and third rows do together. There are more than sixteen mobile subscriptions for every one fixed broadband subscription. A Philippine study that assumes respondents have a stable home connection is designing for a minority.
🔴 The trap: the internet-user series fell ten points in one year
This is the part to read before you cite anything.
| Year | Individuals using the internet (% of population) |
|---|---|
| 2019 | 43.03 |
| 2020 | 53.76 |
| 2021 | 66.91 |
| 2022 | 75.21 |
| 2023 | 77.87 |
| 2024 | 67.26 |
The series falls 10.61 percentage points between 2023 and 2024. Read as a trend, that says roughly eleven million Filipinos stopped using the internet in a year, which is not a plausible description of the world.
What it is, is a discontinuity in the series — the kind that appears when the underlying survey, definition or reporting source changes. This article does not assert which of those it was, because that is not something the API tells you and no reachable source states it.
What matters for your manuscript is the practical rule, and it is simple. Cite the year and the indicator, never a bare percentage. “77 per cent of Filipinos use the internet” is a sentence a panellist can break by opening the same dataset. “67.26 per cent of the Philippine population were internet users in 2024 (World Bank, IT.NET.USER.ZS, updated 13 July 2026)” is a sentence that survives, because it says exactly what it is.
And if your study spans years, say so explicitly: a figure drawn from a series with a visible break should be presented as two segments, not one line.
Why “115 subscriptions per 100 people” does not mean everyone has a phone
This is the second figure students misread, and misreading it in a defense is expensive.
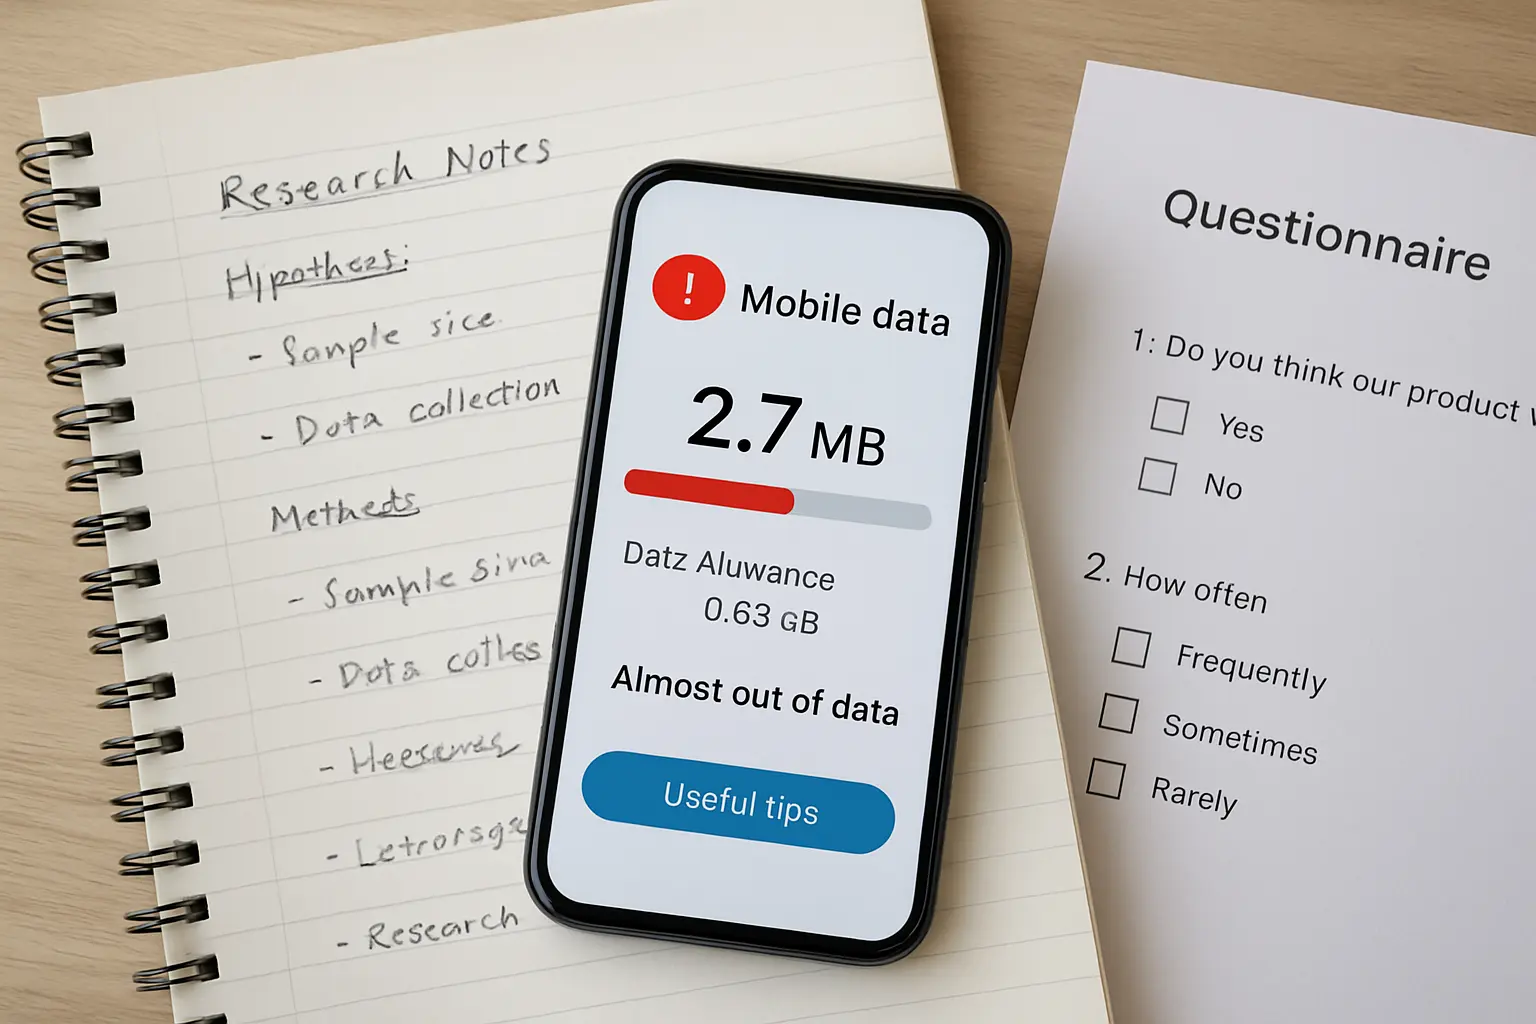
Mobile cellular subscriptions are counted per subscription, not per person. A figure above 100 does not mean more than 100 per cent of the population has a phone. It means the number of active SIM subscriptions exceeds the population, which happens when people hold two SIMs on different networks — an entirely ordinary arrangement in the Philippines.
So the correct sentence is “there were 115.30 mobile cellular subscriptions per 100 people in 2024”, not “115 per cent of Filipinos have mobile phones”. The second version is not a rounding error; it is a category error, and it is exactly the kind of thing a methodologically minded panellist picks up.
The series is also volatile enough to be worth a caveat if you use more than one year of it: 151.01 in 2019, 133.46 in 2020, 147.43 in 2022, 117.28 in 2023, 115.30 in 2024. Quote the year.
The fixed broadband series, and what it means for your respondents
| Year | Fixed broadband subscriptions (per 100 people) |
|---|---|
| 2016 | 2.80 |
| 2018 | 3.46 |
| 2020 | 7.08 |
| 2021 | 8.51 |
| 2022 | 7.64 |
| 2023 | 6.54 |
| 2024 | 7.14 |
Two things stand out. The rate more than doubled between 2018 and 2020 and has been broadly flat since, hovering between 6.5 and 8.5. And the absolute level remains low: fewer than one subscription for every thirteen people.
Because a household subscription serves several people, the share of Filipinos with access to fixed broadband is higher than 7.14 per cent — but you cannot derive that number from this indicator, and you should not try. If your study needs household-level access, say that the indicator measures subscriptions rather than households and treat it as a floor.
How to use these figures in Chapter 1
Connectivity figures earn their place in a background section when they establish a constraint your study operates under. Three patterns work.
- As a rationale for the problem. “With 7.14 fixed broadband subscriptions per 100 people in 2024 (World Bank), online learning in the locale depends predominantly on mobile connections.” This justifies studying something about mobile-first learning.
- As a delimitation. If you distributed an online questionnaire, the connectivity profile explains who could and could not respond, which is a limitation worth stating rather than hiding.
- As a comparison anchor. National figures give your locale-level finding something to sit against — “respondents reported a lower rate of home connectivity than the national subscription figure would suggest”.
What connectivity figures cannot do is stand in for a finding. A background section that recites four national percentages and never connects them to the specific problem is padding, and advisers send it back. The section-by-section structure that avoids that is in the guide to writing Chapter 1, and where a background sits relative to everything else is in the overview of Chapters 1 to 5.
What no national dataset gives you
Three things students look for and will not find, stated plainly so you stop looking.
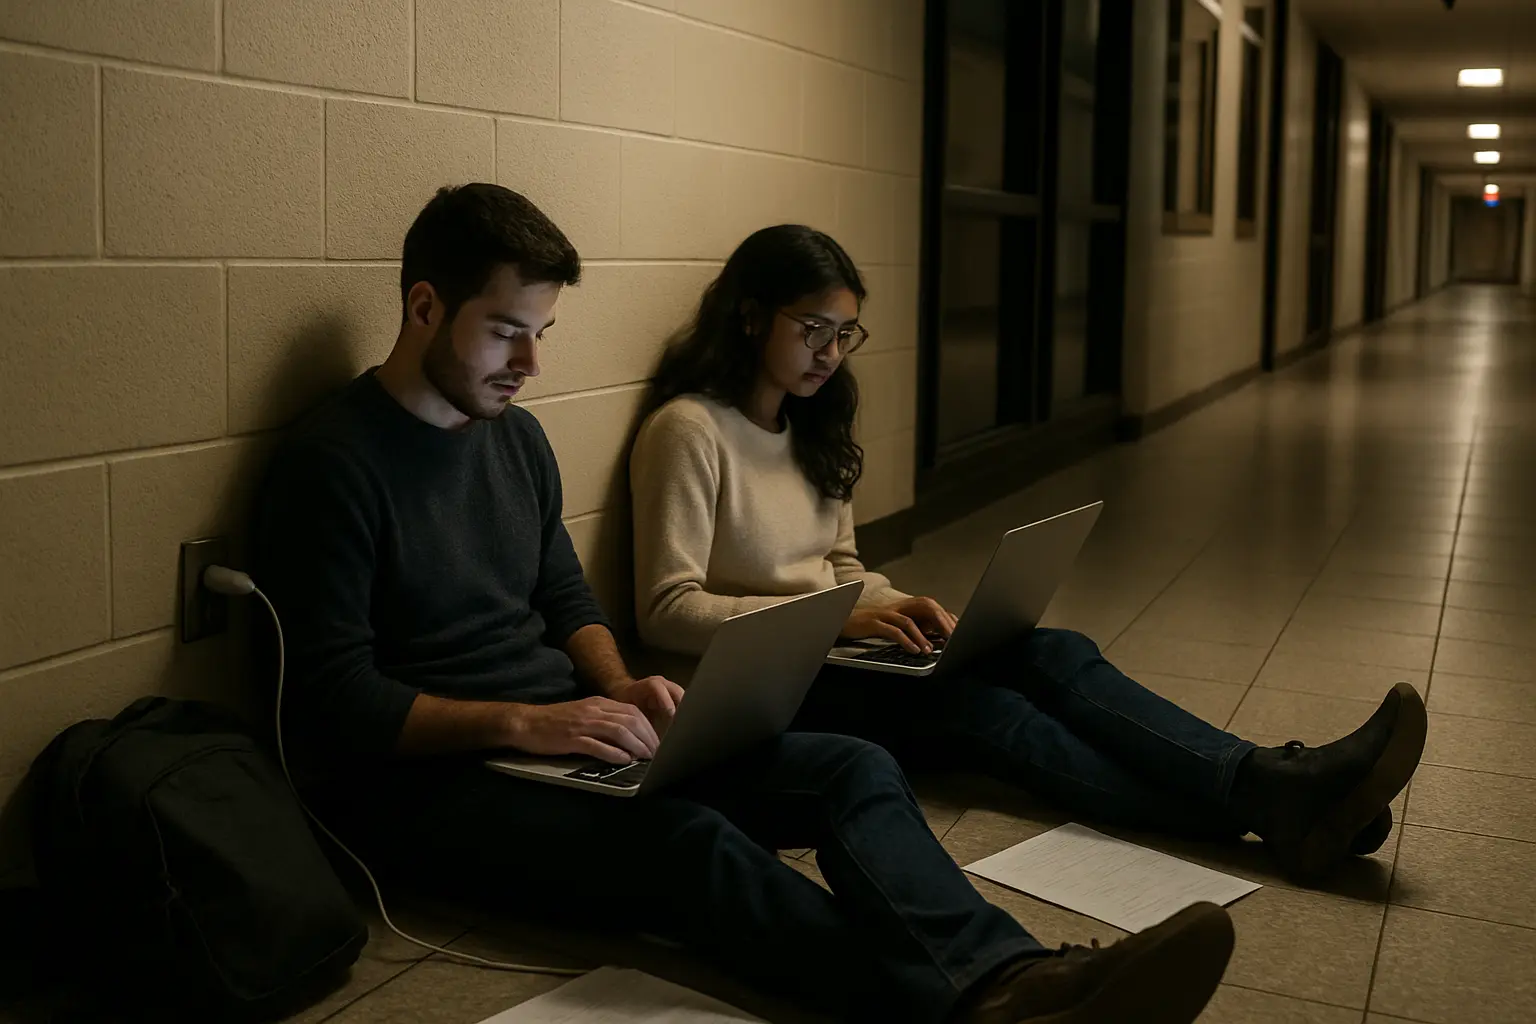
A student-specific connectivity rate. Every indicator above is population-wide. There is no reachable national dataset breaking internet use down to tertiary students as a group. If your study needs that number for your locale, you have to measure it — which is a perfectly good justification for a survey item.
Campus connectivity. Institutional wifi availability is not in any national series, and for a large share of students it is where their coursework actually happens.
Cost per gigabyte over time. Prices change faster than any published dataset tracks, and quoting a figure from a secondary source without a date is how a background section acquires a number nobody can verify.
Two Philippine government sources that would ordinarily fill some of these gaps could not be read first-hand for this article. dict.gov.ph returned 403 (a Cloudflare interstitial, 752 visible characters) and psa.gov.ph also refused automated requests. No figure is attributed to either here, and none should be attributed to them by anyone who has not opened them.
Where the enrolment figure fits
Tertiary gross enrolment gives you the denominator for a lot of Chapter 1 claims: 47.41 per cent in 2024, up from 31.63 per cent in 2020 on the same series. That is a substantial expansion in four years.
Gross enrolment ratios can exceed 100 per cent because they count all enrolled students against the population of the standard age group, so treat the number as a participation measure rather than a share of young people. The enrolment picture in more detail, drawn from Philippine sources rather than the World Bank, is in the roundup of Philippine higher education statistics, and what happens to those students afterwards is in the article on graduate employment outcomes.
How to check any of this yourself
The World Bank indicator API is open, needs no key, and returns JSON in a browser. The pattern is:
https://api.worldbank.org/v2/country/PH/indicator/IT.NET.USER.ZS?format=json&date=2015:2026
Swap the indicator code for IT.CEL.SETS.P2, IT.NET.BBND.P2 or SE.TER.ENRR to reproduce every table above. The response header carries the lastupdated date, which is the date you cite.
Do this rather than copying a figure from another thesis. Reproducing the query takes a minute, it gives you the current value rather than a two-year-old one, and it means you can answer “where did that number come from?” with a URL. The same discipline applies to any statistic in your background section — including the ones in board exam passing rates and what free tuition under RA 10931 actually covers.
Keep every figure attached to the source you actually opened
Tesify keeps citations attached to the sources you opened as you draft, so a background section full of national statistics can be traced back line by line when a panel asks. Over 9,000 students have used it to write more than 15,000 chapters, and every word is still written by you.
Frequently asked questions
What percentage of Filipinos use the internet?
67.26 per cent of the population in 2024, according to the World Bank indicator IT.NET.USER.ZS as updated on 13 July 2026. Cite the year and the indicator, because the same series reports 77.87 per cent for 2023 and the difference is a discontinuity rather than a real fall.
Why is the 2024 figure lower than the 2023 figure?
The series contains a break between those two years. An eleven-million-person decline in internet use in one year is not a plausible real-world event, so the change reflects the measurement rather than the behaviour. This article does not assert the cause, because no reachable source states it.
How many Filipinos have home broadband?
There were 7.14 fixed broadband subscriptions per 100 people in 2024. Because one subscription can serve a household, the share of people with access is higher than that, but the indicator counts subscriptions and cannot be converted to a household figure.
Does 115 mobile subscriptions per 100 people mean everyone has a phone?
No. It counts active subscriptions, and many people hold two SIMs on different networks. Write it as “115.30 subscriptions per 100 people”, never as a percentage of people owning phones.
Is there a statistic specifically about Filipino students?
Not in any reachable national dataset. Every figure here is population-wide. If your study needs a student-specific rate for your locale, measuring it is a legitimate objective for your own survey.
Can I cite the World Bank in an APA 7th reference?
Yes. Treat it as a dataset or online report with the World Bank as the author, the indicator name as the title, and the date you retrieved it. Include the API or indicator URL.
Which year should I use?
The most recent one in the series, which is currently 2024 for all four indicators here, and say so explicitly. Do not mix a 2024 figure for one indicator with a 2021 figure for another without noting it.
Why not use PSA or DICT figures?
They would be preferable as national sources where they publish the same measures, but both refused automated requests when this article was prepared, so nothing here is attributed to them. If you can open them, use them and cite them directly rather than through a secondary source.
What is a gross enrolment ratio?
Total enrolment in a level of education, regardless of age, expressed as a percentage of the population of the official age group for that level. It can exceed 100 per cent, so read it as a participation measure and not as a share of young people enrolled.
How often do these figures change?
The World Bank restates its series periodically, and the values themselves can be revised, not only extended. Re-run the query rather than reusing a figure you saved earlier in the semester — the 2023 and 2024 rows in this article are a demonstration of why.
Where should connectivity statistics appear in my thesis?
Background of the study in Chapter 1 if they establish the problem, and scope and delimitation if they constrain who could participate. They do not belong in Chapter 4, which reports your data rather than other people’s.