
You substitute the test, not the data. An independent-samples t test becomes the Mann-Whitney U test, a one-way ANOVA becomes Kruskal-Wallis, and Pearson’s r becomes Spearman’s rho. Then you add one sentence to Chapter 3 saying the substitution was made because the normality assumption was not met. Nothing is deleted and nothing is transformed away.
Why does this feel like a disaster when it is not?
Because it usually arrives at the worst possible moment. You have collected your data, you have encoded it, you are two weeks from submission, and a test you ran almost as a formality has come back significant. The instinct is that something is wrong with your respondents.
Nothing is wrong with your respondents. Most real undergraduate data is not normally distributed, and Likert data in particular rarely is: a four-point scale on which most people agree produces a lump at the top and a tail at the bottom, which is exactly what a skewed distribution looks like. The statistical machinery anticipated this, which is why there is a documented alternative for every test you might have planned.
What you cannot do is run the parametric test anyway and hope nobody checks. A panellist who asks “did you test for normality?” and receives no answer has found a hole in Chapter 3, and it is a hole that takes ten minutes to fill.
How do you actually test for normality?
In SPSS the procedure is Analyze > Descriptive Statistics > Explore. Put your continuous variable into the Dependent List, open Plots, and tick Normality plots with tests.
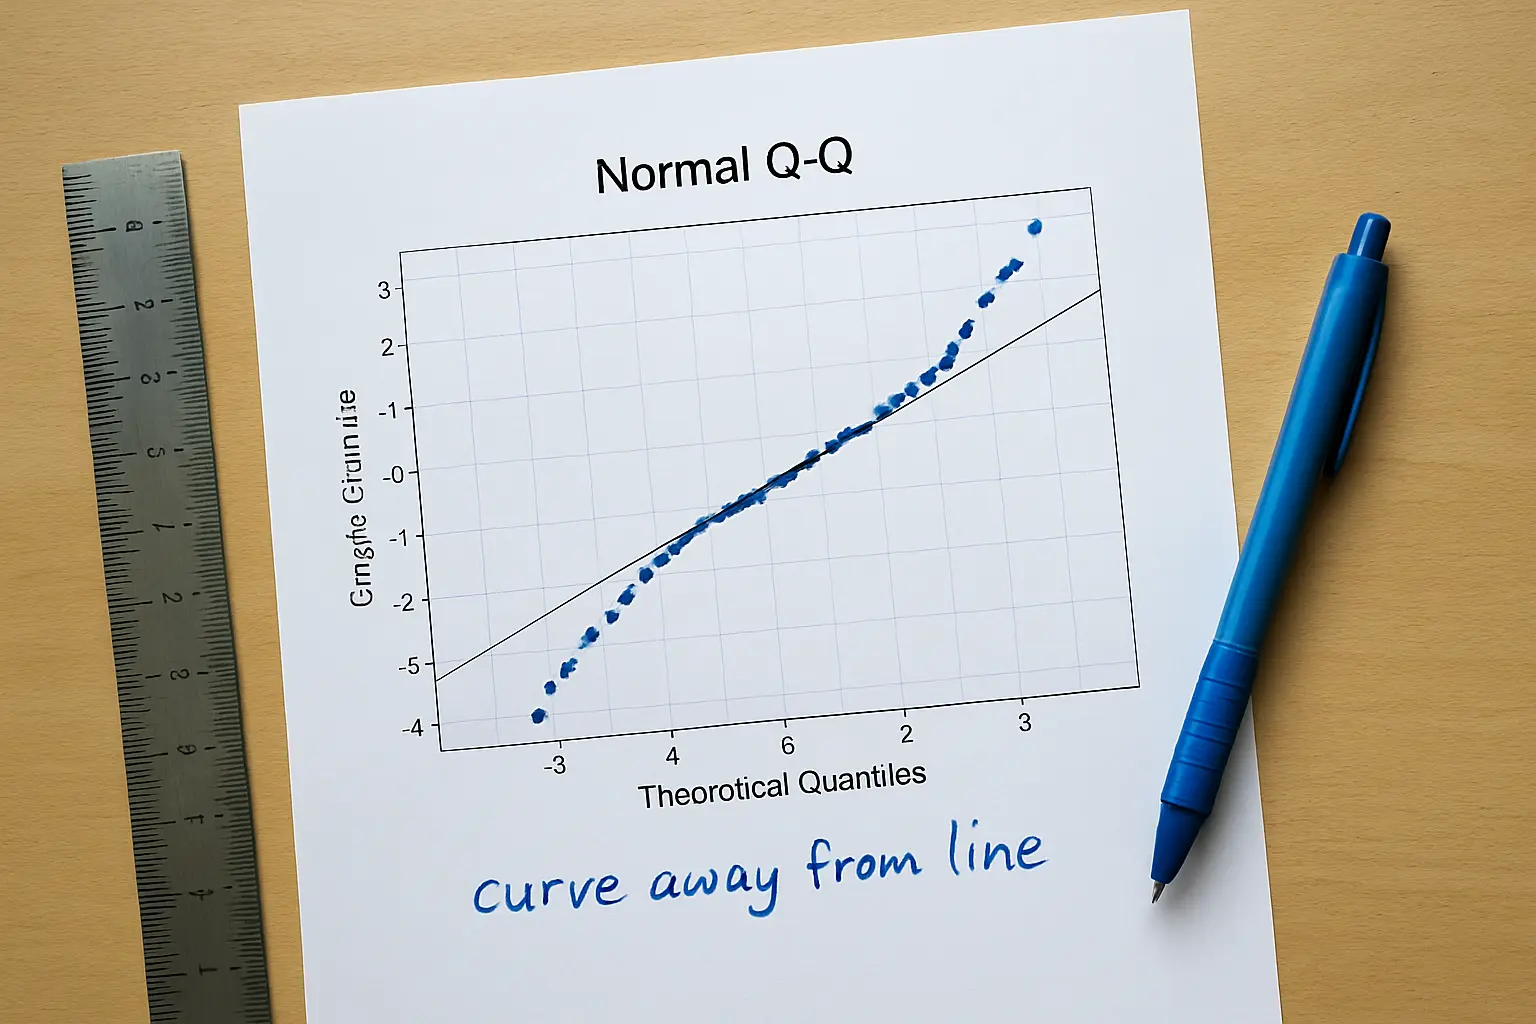
That single checkbox produces four things at once, and it is not possible to request the statistics without the plots: a Kolmogorov-Smirnov test, a Shapiro-Wilk test, a normal Q-Q plot and a detrended normal Q-Q plot. If you also add a grouping variable to the Factor List, the Spread vs Level with Levene Test option gives you Levene’s test for homogeneity of variance, which is the second assumption most undergraduate designs need.
Where this fits in the wider order of operations — encoding, screening, reliability, then testing — is set out in the guide to analysing your thesis data in SPSS step by step.
How do you read the result, given that the p-value runs backwards?
This is the part that trips up almost everyone, and it is worth stating slowly.
The null hypothesis of a normality test is that the sample was drawn from a normal distribution. So the usual decision rule applies, but the meaning is inverted:
- p > .05 — you do not reject the null. There is not enough evidence to call the data non-normal. You may proceed with the parametric test. This is the outcome you want.
- p ≤ .05 — you reject the null. There is sufficient evidence that the data is not normally distributed. Switch tests.
Everywhere else in your thesis a significant result is the interesting one. Here it is the inconvenient one. Students who carry the usual habit across read a Shapiro-Wilk of p = .003 as confirmation that everything is fine, write the parametric test up, and are corrected at the defence.
Two further points of precision. The Kolmogorov-Smirnov and Shapiro-Wilk tests carry separate p-values and they can disagree — one may indicate non-normality while the other does not, and you should say which one you used rather than quietly reporting the friendlier one. And a small p-value implies but does not prove non-normality, which is why you read the histogram and the Q-Q plot alongside the number rather than instead of it.
What replaces what?
Every parametric test an undergraduate thesis is likely to use has a standard substitute, and the substitution answers the same research question. You are not weakening the study; you are using the test that fits the data you have.
| What your problem asks | Parametric test | Substitute when normality fails |
|---|---|---|
| Do two independent groups differ? | Independent-samples t test | Mann-Whitney U test |
| Do the same respondents differ before and after? | Paired-samples t test | Wilcoxon signed-rank test |
| Do three or more groups differ? | One-way ANOVA | Kruskal-Wallis test |
| Are two variables related? | Pearson’s r | Spearman’s rho |
Kent State University Libraries’ SPSS reference states the first and third of these explicitly: when one or more assumptions of the independent-samples t test are not met you may want to run the non-parametric Mann-Whitney U test instead, and when the normality, homogeneity of variance or outlier assumptions of a one-way ANOVA are not met you may want to run the Kruskal-Wallis test instead.
Two of these you already have a route to. Spearman’s rho is a tick-box inside the same Analyze > Correlate > Bivariate dialog you would have used for Pearson. The rest live under Analyze > Nonparametric Tests. The mapping from your statement of the problem to a test in the first place is in the guide to the statistical treatment of data in a thesis.
What if it is the equal-variances assumption that failed instead?
That is a different failure with a different, easier answer. Levene’s test asks whether two groups have the same variance; a significant Levene’s result means they do not.
For an independent-samples t test you do not need to leave the parametric family at all. SPSS reports an alternative statistic that does not assume equal population variances — the Welch t test, also called the unequal-variance or separate-variances t test — on the second line of the same output block. Read that line instead of the first and say in your write-up that you did.
One current detail worth knowing, because most guides written before 2026 have it wrong: prior to SPSS Statistics version 31, Levene’s Test was produced automatically as part of the Independent Samples t Test output. As of version 31 it is optional output that must be requested. If your output has no Levene’s row and you were expecting one, that is why — go back into the dialog and ask for it.
For a one-way ANOVA with unequal variances, the post hoc tests that assume equal variances are no longer trustworthy; use a post hoc option that does not, such as Dunnett’s C.
Does any of this apply to Likert data at all?
It depends on what you did with the Likert items, and Philippine research manuals differ on this.
A single Likert item is ordinal. Strictly, it has no mean, and the correct measures are the median and the mode. Many Philippine manuals nonetheless require a weighted mean per item with a verbal interpretation band, and where your manual requires it, you follow your manual.
A scale score — several items averaged into one measure of a construct — is much more defensible as a continuous variable, and it is the thing worth testing for normality. So test the computed scale score, not each of your fifteen individual items. Fifteen normality tests on fifteen ordinal items is a page of output nobody asked for.
If the design decision itself is still open, the trade-offs between measuring numerically at all and interviewing instead are laid out in quantitative vs qualitative research for a thesis.

What exactly do you write in the manuscript?
Two sentences in Chapter 3, and a normal report in Chapter 4.
Chapter 3, in the statistical treatment section: “The Shapiro-Wilk test indicated that the distribution of the composite scores departed significantly from normality (p < .001). The Mann-Whitney U test was therefore used in place of the independent-samples t test to determine the difference between groups under Problem 3.”
Chapter 4, reporting the result: “Male and female respondents did not differ significantly in perceived competency transfer, U = 12,840.50, p = .21. The null hypothesis is not rejected.”
Note that the second sentence has exactly the same shape as the parametric version — statistic, value, exact p, decision — and follows the same APA conventions on decimals and leading zeros. Those conventions, and the interpretation paragraph that goes under the table, are in the guide to writing Chapter 4 table by table. Whatever you change here must also be reflected in the statistical treatment paragraph of Chapter 3, because a Chapter 4 running a test Chapter 3 never named is a contradiction a panel finds immediately.
Change the test, then change the chapter in an evening
Tesify keeps your methodology and results chapters in the structure your research manual expects, so a switched test costs one paragraph rather than a rebuilt chapter. Over 9,000 students have used it to write more than 15,000 chapters, and every word is still written by you.
Frequently asked questions
What do you do if your data is not normally distributed?
Substitute the test. Mann-Whitney U replaces the independent-samples t test, Wilcoxon signed-rank replaces the paired-samples t test, Kruskal-Wallis replaces one-way ANOVA, and Spearman’s rho replaces Pearson’s r. Then record the substitution and its reason in Chapter 3.
What does a significant Shapiro-Wilk result mean?
That your data is not normally distributed. The null hypothesis is normality, so rejecting it rejects normality. A p-value at or below .05 is the outcome that forces a change of test.
Which normality test should I report?
SPSS produces Kolmogorov-Smirnov and Shapiro-Wilk together and they carry separate p-values that can disagree. State which one you used and stay with it; do not report whichever came out friendlier.
Where is the normality test in SPSS?
Analyze > Descriptive Statistics > Explore, then Plots, then tick “Normality plots with tests”. You cannot get the statistics without the plots — the option produces both.
Do I have to delete outliers?
No, and you should not delete a legitimate response just because it is extreme. Remove a case only when it is an impossible value traceable to an encoding error, and say in your limitations how many cases were removed and why.
Should I transform my data instead?
Transformations such as a log or square root exist, but they change what your numbers mean and every result then has to be interpreted on the transformed scale. For an undergraduate thesis on a semester timeline, the non-parametric substitute is simpler to run, simpler to explain and simpler to defend.
Is a non-parametric test weaker?
It has less statistical power than its parametric counterpart when the parametric assumptions genuinely hold. When they do not hold, the parametric test is not more powerful — it is wrong. The correct comparison is against a valid alternative, not against an invalid one.
My sample is large. Do I still need to test normality?
Test it and report it. Some panels accept an argument from sample size; others do not, and the test costs one dialog box. Having the result and not needing it is a far better position than needing it and not having it.
What if only one of my variables is non-normal?
Only the analyses involving that variable change. A study can legitimately report Pearson’s r for one relationship and Spearman’s rho for another, as long as the statistical treatment section says which was used where and why.
Is Levene’s test the same as a normality test?
No. Normality tests ask about the shape of one distribution; Levene’s test asks whether two or more groups share the same variance. They are separate assumptions with separate remedies, and a design can fail one and pass the other.
My adviser says to ignore it and run the t test anyway. What do I do?
Ask for the reason in writing and record it. There are defensible reasons a supervisor might give, and a documented instruction is something you can cite at the defence. What you should not do is run the parametric test with no reason recorded anywhere.