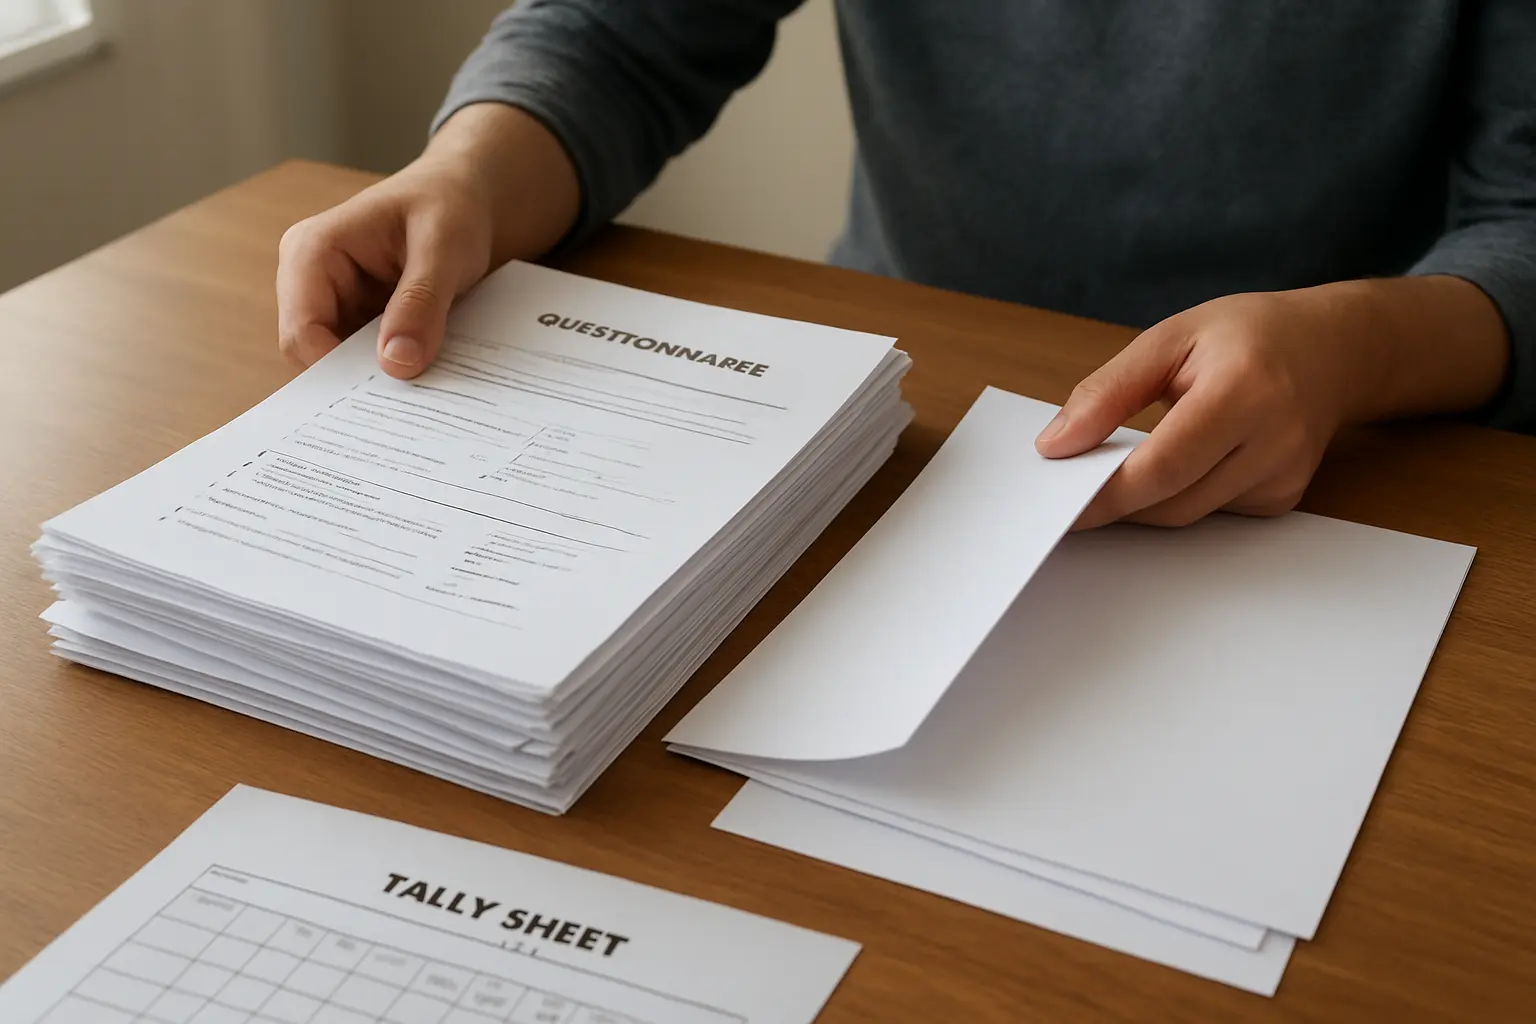
Decide the discard rule before you look at any result, code the blanks as missing rather than typing zero, and report the retrieval rate in Chapter 3. A questionnaire missing one item is usable. A questionnaire missing a whole section is not. Your Chapter 4 tables will honestly report different sample sizes, and that is expected.
What actually came back?
Three different problems get called “incomplete” and they have different answers.
- Unreturned. You distributed 344 and got 300 back. Nothing is wrong with the 300; you have a retrieval rate to report.
- Item non-response. A returned form with a few blanks — usually the demographic question people find intrusive, or the last page of a long instrument.
- Spoiled. A form with a whole section blank, every item ticked identically down the page, or two boxes ticked where one was required.
Count each category before you encode anything. Those three numbers are what you will write in Chapter 3, and reconstructing them after encoding is impossible.
When should you throw a questionnaire out?
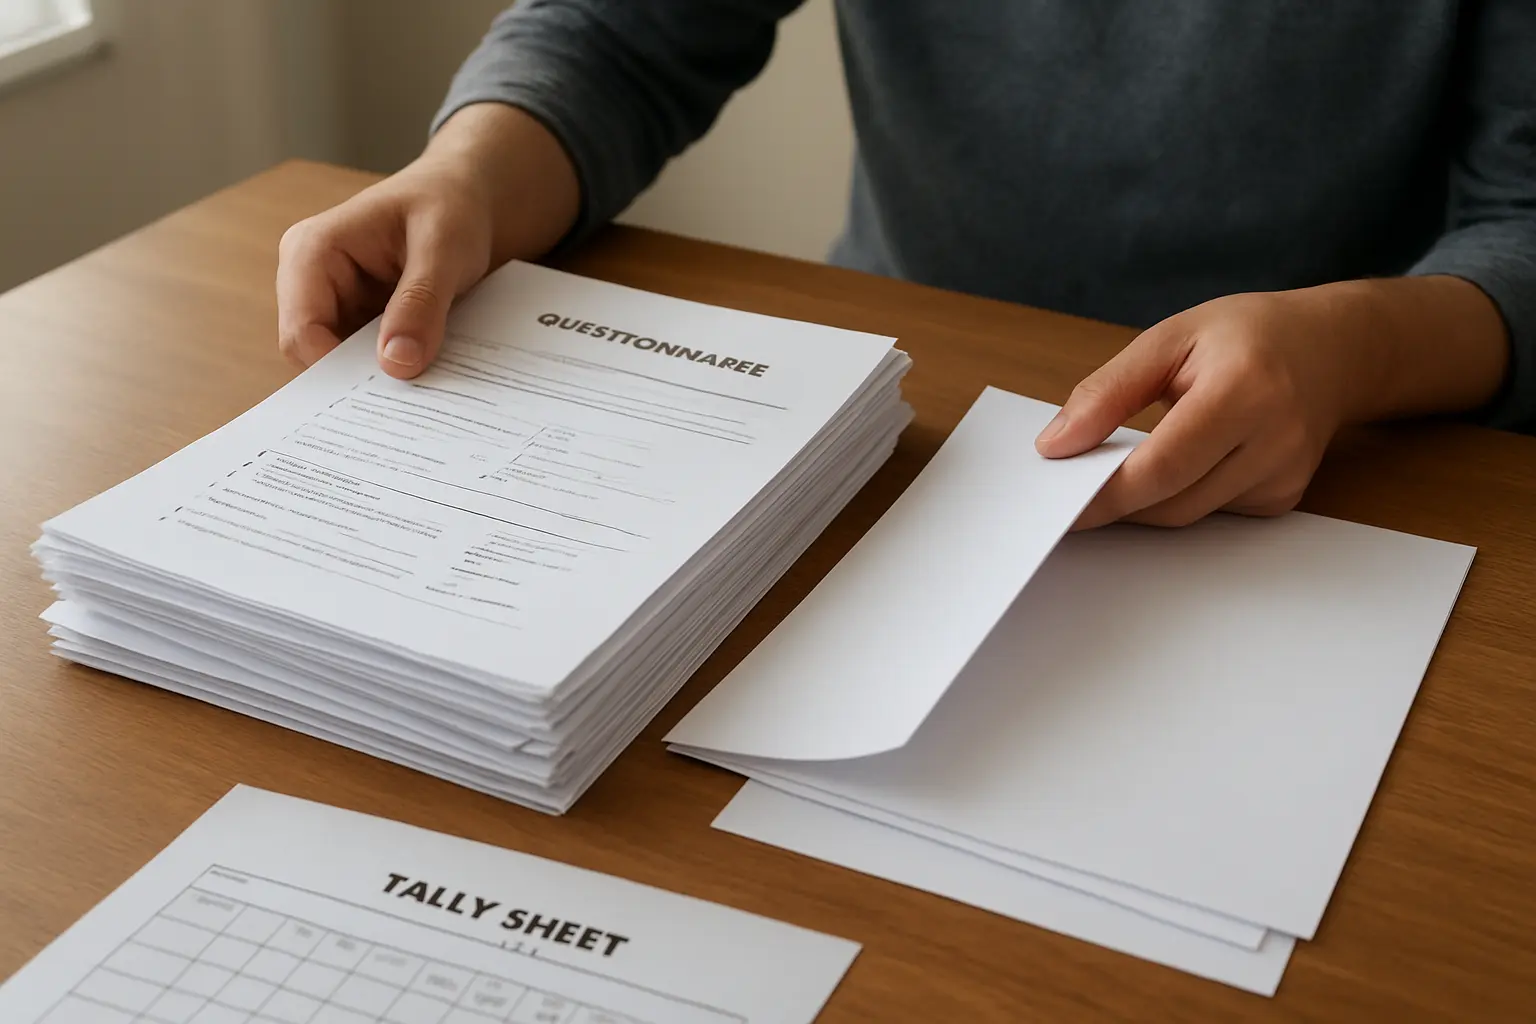
Write the rule down before you look at a single result, and apply it to every form without exception. A rule invented after you have seen which direction the numbers are going is not a rule, and a panel that suspects it will ask how many forms you removed and why.
A defensible rule for an undergraduate instrument looks like this, and you can state it in one sentence:
“A returned questionnaire was excluded if any full section was unanswered or if more than ten per cent of its items were blank; otherwise it was retained and individual blanks were treated as missing values.”
Two forms that must always go: one where the respondent did not meet your inclusion criteria, and one where the same option is ticked for every item including the reverse-worded ones, which is evidence the form was not read. Say in your write-up how many you removed under each condition. A stated exclusion is a design decision; an unstated one is a hole.
Why is a blank not a zero?
Because zero is a value and blank is the absence of one. On a four-point scale, typing 0 into an unanswered cell pulls every mean towards zero and quietly corrupts every statistic computed from that variable. It is the single most damaging encoding mistake in an undergraduate thesis and it is invisible in the output — the numbers look fine, they are simply wrong.
SPSS handles this properly if you let it. Kent State University Libraries’ SPSS reference sets out the mechanics: SPSS has a default missing value code for numeric variables, the full stop, and the Missing column in Variable View “allows the user to specify up to three unique missing value codes for the given variable; or, to specify a range of numbers to treat as missing, plus one additional unique missing value code”.
In practice:
- Leave a genuinely blank cell empty in Data View. SPSS already treats it as system-missing.
- Where you need to distinguish reasons — refused, not applicable, unreadable — use codes that cannot occur in your data, such as -99 and -88, and declare them in the Missing column of Variable View.
- In syntax that is
MISSING VALUES num1 (-999).for one code, orMISSING VALUES num1 (-999, -888).for two. - Never use 9 or 99 as a missing code on a scale where those could be real values.
Do this at the variable-definition stage, before you encode a single case. Where it fits in the wider order of operations is set out in the guide to analysing your thesis data in SPSS.

Why do my tables show different sample sizes?
Because of how the software decides which cases to use, and it is worth understanding rather than hiding.
When you run a correlation, SPSS asks whether to exclude cases listwise — drop any respondent missing any variable in the analysis — or exclude cases pairwise, which uses every respondent who answered the particular pair being correlated. Kent State’s reference notes that the choice “does not affect your computations if you are only entering two variables, but can make a very large difference if you are entering three or more variables into the correlation procedure”.
Their worked example shows exactly what a reader sees. In one correlation table, height has 408 non-missing observations, weight has 376, and the correlation between them is computed on the 354 respondents who answered both. Three numbers, one table, all correct.
What this means for your Chapter 4: put the n in every table note. A reader who finds n = 300 in Table 3 and n = 288 in Table 5 will assume an error unless the table says why. The conventions for table notes are in the guide to writing Chapter 4 table by table.
For an undergraduate thesis, pairwise is usually the honest default because it uses the data you actually collected. Listwise is the conservative choice and is appropriate when every analysis must rest on the identical set of respondents. Pick one, say which in Chapter 3, and do not switch between analyses to improve a result.
Should I estimate the missing answers instead?
No, not at undergraduate level. Techniques exist for filling gaps — mean substitution, regression imputation, multiple imputation — and every one of them requires you to defend an assumption about why the data is missing. A panel that asks “how do you know the non-responders were like the responders?” is asking a question you cannot answer from your data.
Mean substitution in particular looks harmless and is not: it shrinks the variance of the variable, which makes standard deviations too small and significance too easy to find. Deleting the case is transparent. Inventing the answer is not, and it can be read as data fabrication if you do not disclose it. If a supervisor instructs you to impute, ask for the method in writing and name it in Chapter 3.
What if I fell below my computed sample size?
This is the specific fear behind most of these questions. Your Chapter 3 computed a sample of, say, 344 by Slovin’s formula, and 300 usable forms came back.
You do not have to recompute anything, and you must not quietly change the formula’s inputs so the answer matches what you got. What you do is state both numbers and the rate:
“Of the 344 questionnaires distributed, 312 were retrieved and 300 were found usable, for a retrieval rate of 90.70% and a usable rate of 87.21%. Twelve forms were excluded because at least one full section was unanswered.”
Then carry the consequence into your limitations. A shortfall you name and explain is far stronger than a perfect retrieval rate a panel does not believe. The section-by-section placement of all of this — respondents, sampling, data gathering procedure — is in the guide to writing Chapter 3.
If your study is qualitative, the equivalent question is not a percentage but whether recruitment continued until nothing new was emerging, which is covered in how many respondents a qualitative thesis needs.
What exactly goes into the manuscript?
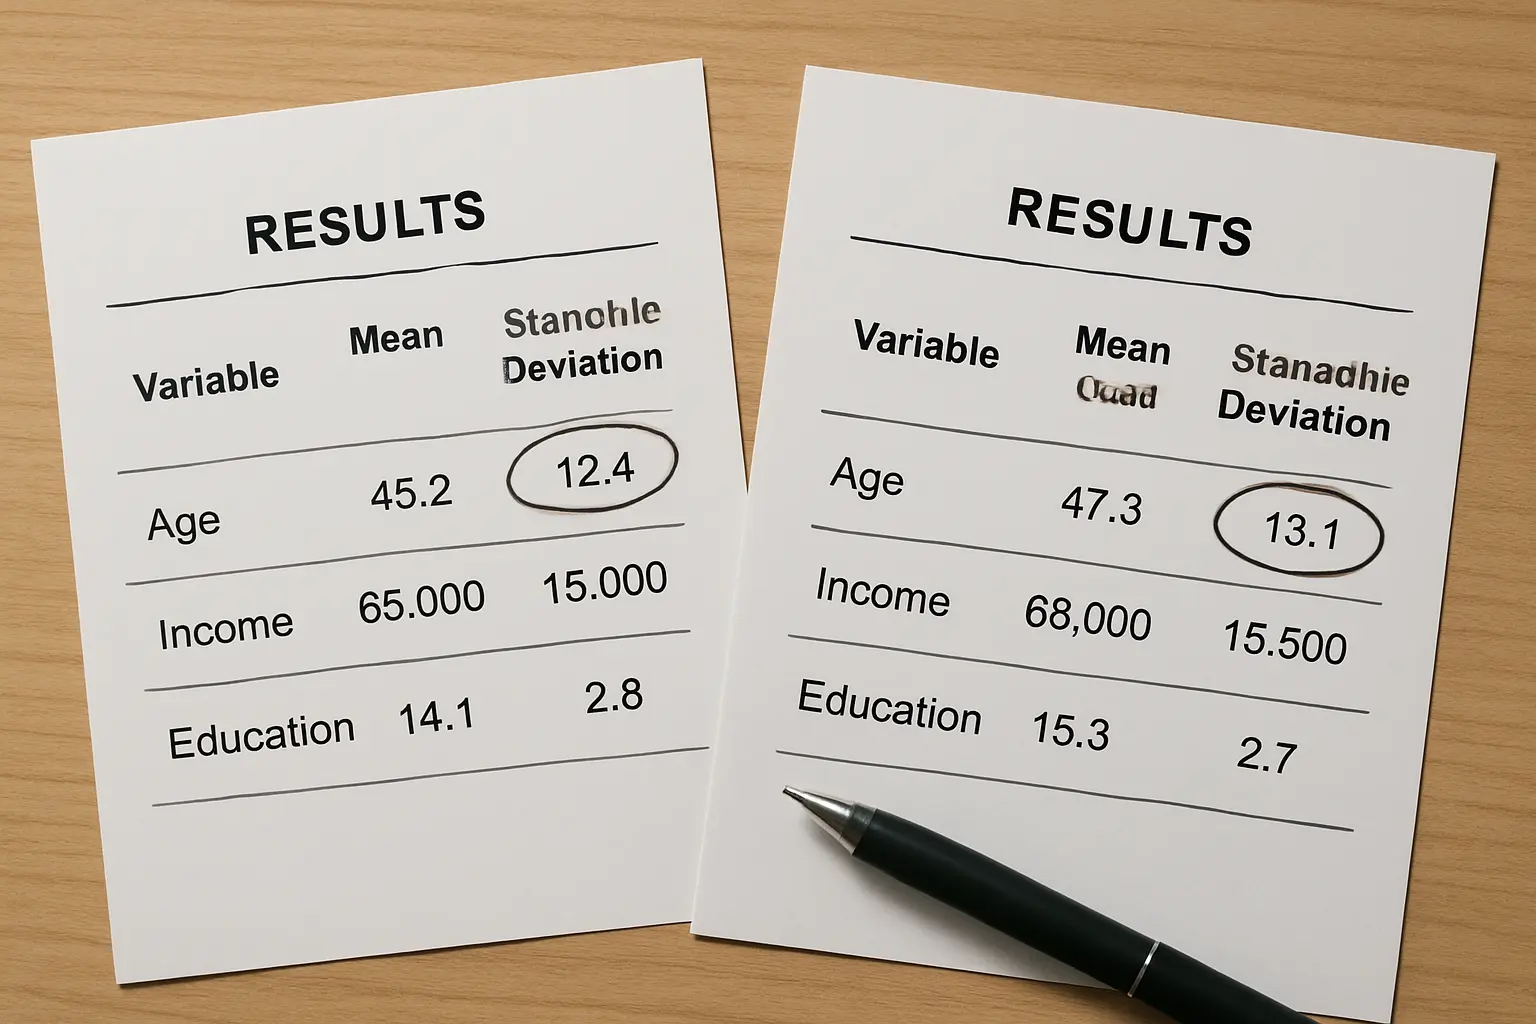
Chapter 3, in the data gathering procedure: the number distributed, retrieved and usable, the retrieval rate, and the exclusion rule in one sentence.
Chapter 3, in the statistical treatment section: one sentence naming how missing values were handled — “Individual missing responses were coded as missing values and excluded pairwise from each analysis.” The rest of that section is described in the statistical treatment of data.
Chapter 4: the n in every table note.
Chapter 5, under limitations: the shortfall and what it means for generalisation, which then constrains how far your conclusions may reach — see how to write Chapter 5.
Write the honest version once, in the right four places
Tesify keeps your methodology, results and limitations in one connected document, so a retrieval rate stated in Chapter 3 is still there when Chapter 5 needs it and your table notes agree with both. Over 9,000 students have written more than 15,000 chapters with it, and every word is still written by you.
Frequently asked questions
What do you do with incomplete questionnaires in a thesis?
Apply a discard rule you wrote before analysis: exclude a form if a full section is unanswered or if more than about ten per cent of items are blank, and keep the rest with individual blanks coded as missing values. Report how many were distributed, retrieved, usable and excluded.
Can I just put zero in the blank cells?
No. Zero is a value and it drags every mean computed from that variable downwards. Leave the cell empty or use a declared missing value code such as -99.
What is the difference between listwise and pairwise deletion?
Listwise drops a respondent from an analysis if they are missing any variable in it. Pairwise uses every respondent who answered the specific pair being compared. The choice makes no difference with two variables and a large difference with three or more.
Is it normal for my tables to show different sample sizes?
Yes, under pairwise deletion. State the n in each table note so the difference reads as a disclosure rather than an error.
How do I set a missing value code in SPSS?
In Variable View, click the Missing cell for that variable and use the Missing Values window. You can declare up to three discrete codes, or a range plus one additional code. In syntax it is MISSING VALUES followed by the variable name and the codes in brackets.
Should I use mean substitution to fill the gaps?
Not for an undergraduate thesis. It shrinks the variance of the variable and makes significance easier to find, and it requires you to defend an assumption about why the data is missing that your study cannot test.
My retrieval rate is 68%. Is that a fail?
No, but it is something you must name and discuss under limitations rather than leave for the panel to notice. Explain the circumstances, and say what it means for how far your conclusions can generalise.
Do I have to distribute more questionnaires to reach my computed sample?
If your timeline allows it and your adviser agrees, yes — a follow-up round is the cleanest fix. If it does not, report the shortfall accurately instead of adjusting the formula’s inputs to match the number you got.
What if a respondent ticked two boxes for one item?
Treat that item as missing for that respondent. Do not choose one of the two on their behalf, and do not average them.
What if online form responses are partial?
A partially completed online submission is the same problem as a partially completed paper form, and it usually arrives as blanks in your export. Apply the identical discard rule, and check the export rather than assuming the platform dropped them.
Will the panel ask about this?
Frequently, and the question is normally some version of “how many did you distribute and how many came back”. Having the four numbers ready is the whole answer — the shape of these questions is in the guide to what panels ask during a defense.
Is this the same as having non-normal data?
No. Missing data is about cases that are absent; normality is about the shape of the values you do have, and it has a different remedy — see what to do if your data is not normally distributed.